Most impression totals overstate what people actually had a chance to see. If only 58% of global desktop web ads were viewable in Q1 2025, then a big share of paid delivery never reached a human on-screen.
Here’s the short version: I look at impressions for delivery, reach for audience size, frequency for repeat exposure, viewability for on-screen quality, and overlap for duplication across channels using top analytics tools and resources. If impressions climb while reach stays flat, the same audience is seeing the ad more often. If viewability is weak, CPM can look fine while spend still leaks.
Before I trust any campaign report, I want answers to 5 questions:
- How many ads were served?
- How many people saw them at least once?
- How often did the same people get hit?
- Did the ad have a real chance to be seen?
- How much cross-channel reach is duplicated?
A few numbers matter right away:
- Frequency = impressions ÷ reach
- Display viewability counts at 50% of pixels in view for 1 second
- Video viewability counts at 50% of pixels in view for 2 seconds
- 25% to 40% of conversions happen across more than 1 device
- About 56.1% of display impressions do not meet MRC viewability guidelines
My takeaway: I do not read impressions on their own. I read delivery, audience, on-screen quality, and duplication together so I can tell whether spend is buying new exposure or just more repetition.
The rest of this guide breaks down how I read each metric, where platform reporting drifts, and what to check before I change budget.
Measuring Reach & Frequency with Brand Report
sbb-itb-5174ba0
Impressions, unique reach, and frequency
Impressions tell you how many times an ad was served. Reach and frequency tell you who saw it and how often. Impressions count every ad display, whether anyone clicked or not. Unique reach counts distinct people who saw the ad at least once. Frequency is impressions divided by reach [1][3][7].
Impressions will always be equal to or higher than reach [3][7]. When that gap gets bigger, frequency is going up. In plain terms, the same people are seeing the ad more often instead of the campaign reaching new people.
Impressions vs. unique reach
Impressions can go up while unique reach stays flat. That usually means your targeting pool is too tight [3][2]. It’s a common sign of saturation, and it often comes with weaker engagement [1][5].
| Metric | Definition | Formula | Best Use Case | Common Limitation |
|---|---|---|---|---|
| Impressions | Total ad displays | Total ad deliveries | Brand awareness and visibility tracking | Doesn't reflect unique audience size |
| Unique Reach | Distinct people exposed at least once | Unique users | Audience penetration and new market growth | Doesn't show exposure frequency |
| Frequency | Average exposures per person | Impressions ÷ Reach | Retargeting and brand recall | Can be skewed by a small group seeing the ad many times |
One thing to watch: platforms don’t all count the same way. So the same campaign can show different totals depending on which report you pull. Using top analytics tools for business can help standardize these metrics across platforms.
How to read frequency without overreacting
A frequency of 2.0 means the average person saw the ad twice. That’s useful, but it’s still just an average. A small group may be getting hit much more often than everyone else.
For cold-prospecting campaigns, frequency above 4 to 6 often points to weaker returns [5]. In most cases, the next move is a creative refresh or a broader audience - not a bigger budget. If frequency is high and CTR is dropping, new creative is usually the better fix [1][8].
Retargeting and small audience segments will run at higher frequency by design because the pool is tight. That can be fine if engagement holds up. If it doesn’t, a frequency cap in your DSP is one of the fastest levers to use [1][9]. Awareness campaigns can usually work with lower frequency than retargeting, but repeated exposure still matters for recall.
High frequency can also make exposure look better than it is if a lot of impressions were never viewable. Served impressions on their own don’t tell the full story.
Viewable impressions and overlap across campaigns
Frequency matters only after you know the impression had a chance to be seen.
Served impressions vs. viewable impressions
A served impression is counted when an ad is delivered, even if it never shows up on a user’s screen. A viewable impression is stricter. It means the ad could actually be seen. Under IAB and MRC standards, a display ad counts as viewable when at least 50% of its pixels are on-screen for at least one continuous second - and for video, that threshold is two seconds [2][5][1].
That gap is not small. A Q1 2025 report found that only 58% of global desktop web ads were viewable [4]. Put plainly, more than 4 in 10 served impressions were never seen. If you’re buying for awareness, vCPM often tells you more than CPM because it focuses on impressions that had an on-screen chance to land.
Third-party verification can help here. Tools from IAS, Moat, or DoubleVerify give you an independent read on viewability instead of relying only on top analytics tools and platform dashboards [5][1]. That’s one of the simplest ways to check whether paid reach is showing up where you think it is.
That’s also where campaign overlap starts to matter.
Overlap and deduplicated reach
Once viewability is clear, the next issue is simple: did those impressions reach new people, or did they hit the same people again?
Unique reach looks at one campaign. Deduplicated reach looks across the full media mix. Even if impressions are viewable, the same person may appear in more than one report when they see ads across multiple platforms or devices. The same person may also be counted twice across devices and platforms.
| Reach Type | Definition |
|---|---|
| Gross Reach | Sum of reach totals across every campaign or channel |
| Overlap | Unique users exposed to ads from more than one source |
| Deduplicated Reach | Total unique individuals reached across the entire media mix |
Research indicates that between 25% and 40% of conversions happen across more than one device [6]. That makes overlap a planning issue, not just a reporting issue. At the same time, privacy rules and the drop in third-party cookies have made deterministic matching harder, so deduplicated reach now leans more on probabilistic matching or panel-based measurement [4][6].
Include overlap estimates in planning so you can separate gross reach from incremental reach and get a better read on how much of your audience is net new.
Reporting gaps in paid search, social, video, and display
Once you account for overlap and deduplicated reach, the next problem shows up fast: channels don't measure delivery the same way. That’s why platform totals drift apart. Each one fires an impression based on its own rules.
Paid search and social media analytics reporting limits
In paid search, Google counts an impression as soon as an ad appears on the search results page, even if the user never scrolls far enough to see it [5]. Since search has no MRC viewability standard, marketers usually look at Impression Share instead. It gives you a practical read on how much of the auction you won, and how much you lost due to budget or ad rank.
Meta and LinkedIn work differently. They use their own visibility thresholds and their own identity systems, so reach and frequency numbers do not dedupe cleanly across platforms. In plain terms, cross-platform reach and frequency comparisons are directional, not exact.
Video and display reporting limits
On YouTube, an impression gets logged when the player loads. A view is stricter: it needs 30 seconds of watch time, or a full watch for shorter formats. So you can end up with high impression volume and low view volume at the same time.
Display has its own issue. An ad can be served without ever being visible. That’s why viewability filters matter. About 56.1% of display impressions do not meet MRC viewability guidelines [6]. When that happens, effective CPM climbs well above the price paid for served impressions.
Why cross-channel totals rarely match
Cross-channel totals rarely line up because platforms use different trigger events, identity systems, device rules, and attribution windows [4][6]. The practical move is simple: read each channel on its own terms instead of trying to force one neat cross-platform total.
A workable setup looks like this:
- Use one main reporting source for each channel
- Apply one verification layer across channels, such as IAS, Moat, or DoubleVerify, to hold viewability to the same standard [5][9]
That’s why delivery, viewability, and deduplicated reach need to be read together, not rolled into one total.
How to read these metrics together and what to do next
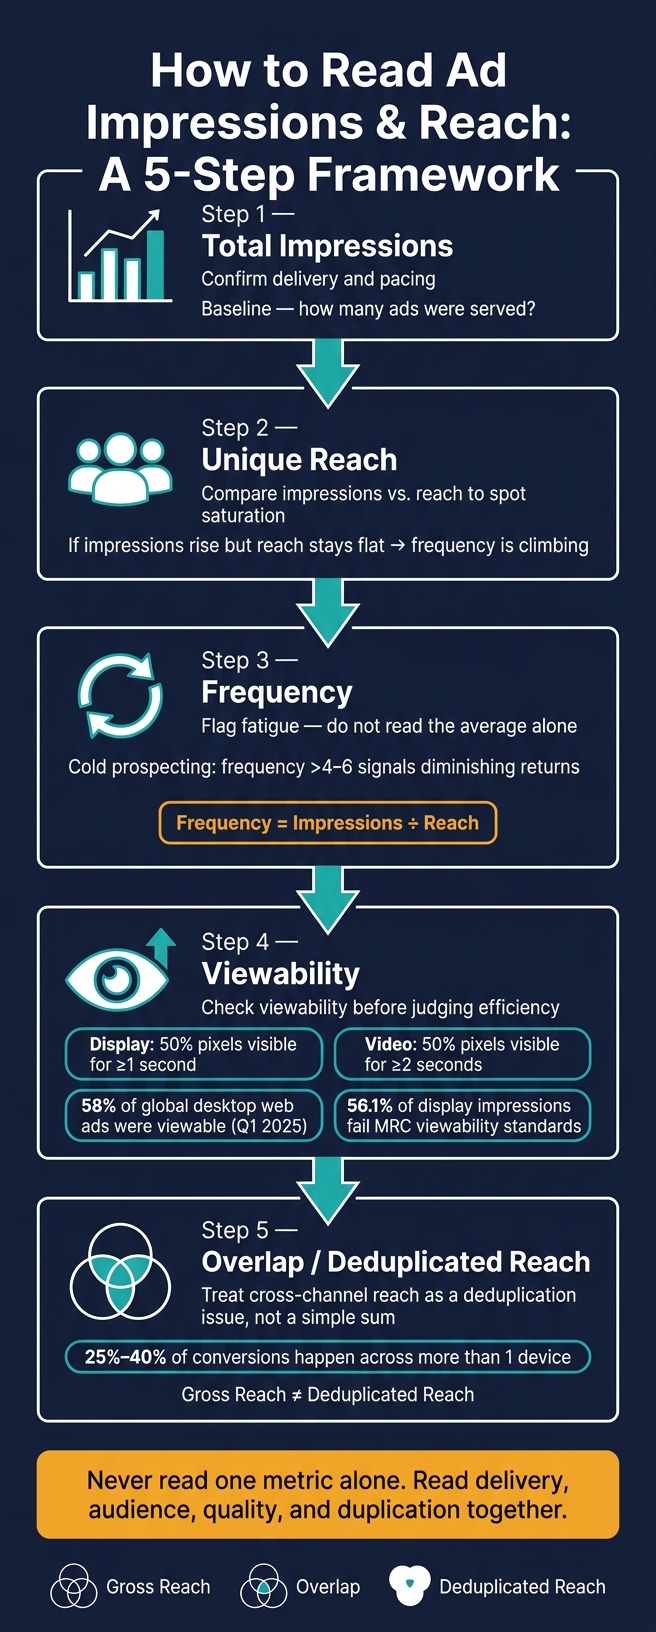
How to Read Ad Impressions & Reach: A 5-Step Framework
Now that the terms are clear, read them in this order: delivery, audience, quality, then duplication. Do not rely on one metric alone. These numbers only mean much when you look at them together.
A practical reading framework for marketers and operators
Use this sequence when you review any report using campaign tracking tools:
- Total impressions - Confirm delivery and pacing.
- Unique reach - Compare impressions against reach to spot saturation.
- Frequency - Use frequency to flag fatigue. Don’t read the average on its own.
- Viewability - Check viewability before you judge efficiency.
- Overlap - Treat cross-channel reach as a deduplication issue, not a simple sum of platform totals.
Platform definitions still vary, so compare like with like.
If CTR is low, check viewability before you assume the audience targeting is wrong. Poor viewability often explains weak interaction better than poor audience targeting does [9]. If frequency is climbing while reach stays flat, it usually means it’s time to refresh the creative or widen the audience.
FAQs
What’s a good frequency for my campaign?
Frequency should match the goal.
For brand awareness, keep frequency on the lower side so you can reach more people. For consideration or conversion campaigns, a higher frequency often makes sense because most people need to see a message more than once before they act.
That said, don’t judge performance by average frequency alone. Averages can blur the fact that some people are seeing the ad too many times. Use frequency caps to limit overexposure, reduce ad fatigue, and cut wasted spend.
Why don’t reach numbers match across platforms?
Reach numbers often differ because platforms don't count views the same way. Each one sets its own rules for when an ad counts as seen. That can depend on how the ad loads, whether it enters the viewport, or how long it stays on screen.
There’s also the traffic quality issue. Platforms filter bots, invalid traffic, and cross-device activity in different ways, so the totals won’t line up perfectly. The practical move is simple: use one consistent source of truth for each channel rather than trying to force raw dashboard numbers to match.
How do I estimate deduplicated reach?
Estimate deduplicated reach by finding unique users, not just total impressions. Platform reports usually sit in silos, so you need a third-party tool that pulls data together and removes overlap across channels. These tools often use cookies, device IDs, or pixels to group exposures tied to the same person.
You can also use surveys to check unique audience exposure, or run controlled experiments to isolate and compare reach across segments. If your setup is more complex, the Marketing Analytics Tools Directory can help you find platforms that bring multi-channel data into one place.