Managing ad spend across platforms like Google Ads, Meta, TikTok, and LinkedIn can be overwhelming, especially when dealing with manual tracking. Automation is the solution. It saves time, improves accuracy, and provides real-time insights to help you make better decisions about your marketing budget using analytics tools for business.
Key Takeaways:
- Manual tracking issues: Time-consuming (8–12 hours/month), prone to errors (70–85% accuracy), and delays decision-making.
- Automation benefits: Cuts tracking time to 15–30 minutes/month, boosts accuracy to 95–99%, and enables real-time adjustments.
- Metrics to focus on: ROAS (Return on Ad Spend), CPA (Cost Per Acquisition), and blended ROAS for a complete performance picture.
- Tools to consider: Dataslayer, Supermetrics, Funnel, and Ryze AI offer varying levels of integration and pricing, starting as low as $49/month.
- Setup essentials: Use a master tracking sheet, integrate automation tools, and standardize metrics across platforms for consistent reporting.
By automating your tracking, you reduce errors, save money, and gain clearer insights into your ad performance, helping you allocate your budget more effectively.
Key Metrics to Track
Core Metrics to Monitor
Streamlining your tracking process across the entire funnel is essential. Use CPM, impressions, and CPV to measure reach; CTR and CPC for engagement; and conversion rate, CPA, and ROAS to evaluate performance.
Among these, ROAS (revenue from ads divided by ad cost) stands out as the primary measure of profitability. To get a complete picture, it's important to track both ROAS and blended ROAS - the latter being total backend revenue divided by total ad spend. Why? Because customer journeys are increasingly complex, with 73% involving three or more advertising touchpoints before a conversion. Businesses using multi-platform attribution tools often report a 23–35% boost in ROAS within just eight weeks.
To make these insights actionable, standardizing metrics across platforms is non-negotiable. This ensures accurate comparisons and better decision-making.
Standardizing Metrics Across Platforms
Ad platforms often use different labels for the same metrics, which can lead to confusion. Here's a quick comparison of how key metrics are named across major platforms:
| Metric | Google Ads | Meta Ads | LinkedIn Ads | TikTok Ads |
|---|---|---|---|---|
| Spend | Cost | Amount Spent | Total Spent | Cash Spend |
| Revenue | Conv. Value | Purchase Value | N/A | Value |
| Clicks | Clicks | Link Clicks | Clicks | Clicks |
Attribution windows are another tricky area. For example, Google Ads defaults to a 30-day window, while Meta and TikTok typically use a 7-day window. This discrepancy can inflate your reported conversions by up to 35% compared to actual backend sales.
"If you're comparing conversion rates across platforms without normalizing the windows, you're comparing apples to somewhere between oranges and watermelons." – Alethia
To avoid this issue, establish a standardized reporting view - like a 7-day click window - across all platforms. This ensures you're making fair, apples-to-apples comparisons. For instance, when analyzing Meta versus Google, rely on "Link Clicks" instead of "All Clicks" on Meta. The latter includes non-traffic actions like profile clicks and comments, which can skew your data. Additionally, leverage Google Analytics 4 as a neutral tool to de-duplicate conversions that multiple platforms might claim simultaneously.
Automated reconciliation tools can further simplify this process, giving you a unified and accurate understanding of your ad spend.
sbb-itb-5174ba0
RedTrack Auto Cost Update: Automate Ad Spend Tracking in 2 Minutes [Feature Teaser]
Manual vs. Automated Tracking
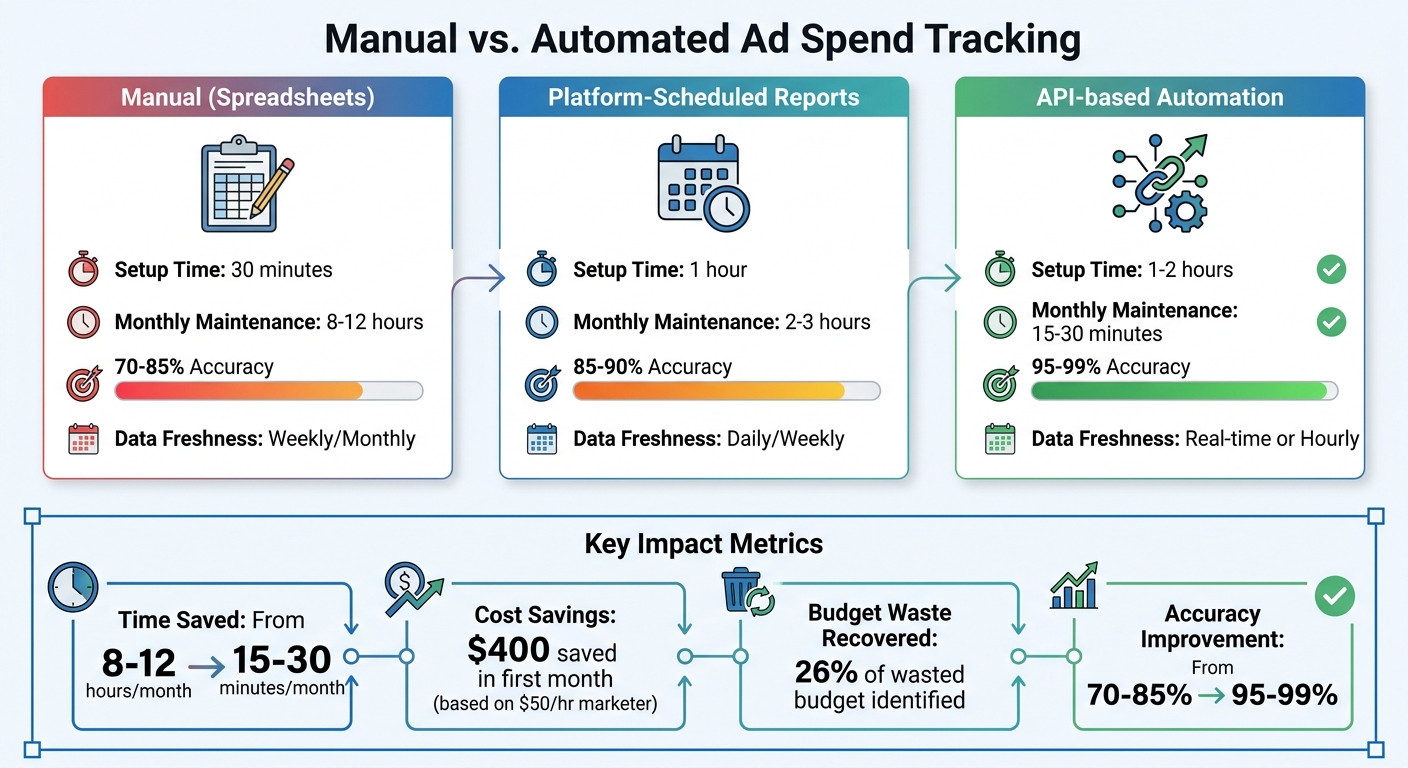
Manual vs Automated Ad Spend Tracking: Time, Accuracy, and Cost Comparison
Comparison Table
When comparing manual and automated tracking, the differences boil down to time investment, accuracy, and data freshness. Automated systems stand out because they connect directly through APIs, handling tasks like currency normalization, time zone adjustments, and date formatting automatically.
Here’s a quick breakdown of how the three main approaches stack up:
| Method | Setup Time | Monthly Maintenance | Accuracy | Data Freshness |
|---|---|---|---|---|
| Manual (Spreadsheets) | 30 min | 8–12 hours | 70–85% | Weekly/Monthly |
| Platform-Scheduled Reports | 1 hour | 2–3 hours | 85–90% | Daily/Weekly |
| API-based Automation | 1–2 hours | 15–30 min | 95–99% | Real-time or Hourly |
Manual tracking tends to focus on historical data and lacks responsiveness, whereas automated systems provide near real-time insights into budget pacing and performance. This makes scalability and up-to-date metrics essential for managing ad spend effectively.
Pros and Cons of Each Method
Let’s dive into the strengths and weaknesses of manual and automated tracking approaches based on the data above.
Manual spreadsheet tracking is budget-friendly upfront, making it a practical choice for small-scale operations. However, as campaigns grow, this method quickly becomes a time sink. Managing dozens - or even hundreds - of campaigns manually can be overwhelming and error-prone.
Automated tracking, on the other hand, offers clear efficiency advantages. For instance, in 2025, Booyah Advertising transitioned over 600 reports to the Improvado automated platform. Marketing Analytics Manager Tyler Corcoran spearheaded this shift, achieving 99.9% accuracy while slashing daily update times from hours to just 10–30 minutes for more than 100 clients. Corcoran highlighted the importance of trust in data:
"If we don't trust the data, the agency won't trust the reports and won't give them to the client. They'll start pulling data manually to Excel and spend a lot of time comparing platform numbers to reports."
While automation has its clear benefits, it does come with costs. API-based tools typically range from $49 to $199 per month, while enterprise-level platforms can exceed $500 monthly. Still, the investment often justifies itself, especially when you consider that marketers lose about 26% of their budgets due to poor tracking. Companies where the CFO and CMO align on spend and ROI data are even 3.5 times more likely to achieve stronger revenue growth.
These factors make a compelling case for automation as a scalable, efficient solution for marketing performance tracking.
Tools for Automating Ad Spend Tracking
Popular Automation Tools
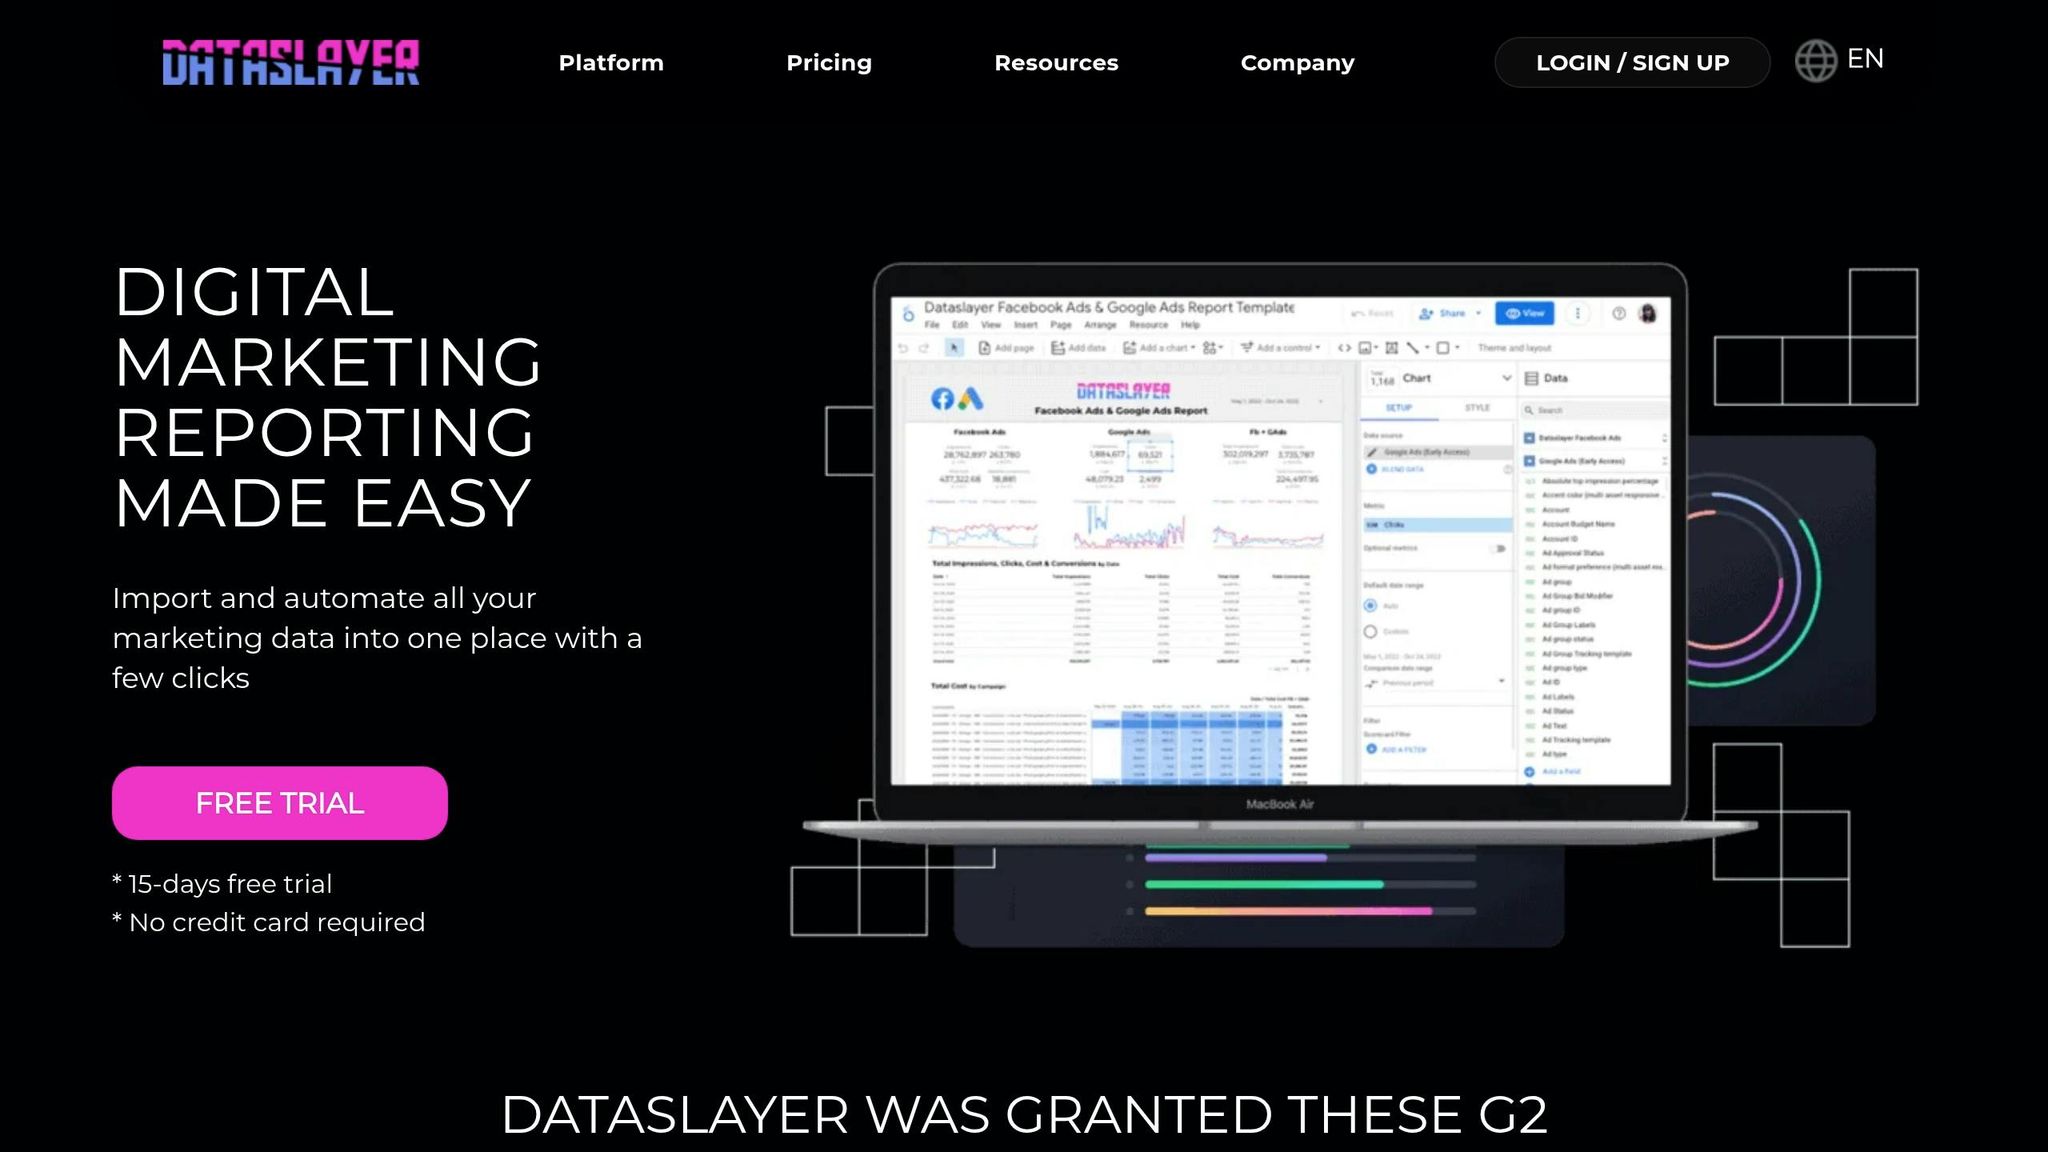
Several platforms are designed to streamline ad spend tracking. Dataslayer, for instance, integrates data from over 50 sources into tools like Google Sheets, Looker Studio, BigQuery, and Power BI. It's ISO 27001 certified, with pricing between $49 and $199 per month. Pamela Solan, a Digital Media Planner at McCANN, shared:
"Dataslayer delivers data faster, more accurately, and more efficiently than Supermetrics, and for a much more economic rate".
Supermetrics is another widely used tool, supporting over 200,000 companies with more than 100 data connectors. It has also incorporated AI platforms like Claude for natural language data analysis. Patrick Siki, a Digital Media Strategist at Accenture, highlighted:
"Every morning, I open the master dashboard that we built with Supermetrics. The main benefit is that it always has fresh and accurate data in a single view".
Supermetrics' pricing starts at $19 per month for basic connectors, scaling up to $999+ for enterprise-level needs.
For larger operations, Funnel stands out with over 600 connectors and the capacity to handle $80 billion in annual ad spend. It features AI-powered insights through "Data Chat" and starts at around $400 per month. Notable successes include Limango reducing its cost per lead by 20% and Sephora cutting data warehouse expenses by 75%.
Ryze AI goes beyond tracking, offering autonomous bid and budget optimization across platforms like Google, Meta, TikTok, and LinkedIn. With a 4.9/5 rating from marketers managing over $500 million in ad spend, it represents a shift toward proactive optimization.
How to Choose the Right Tool
Your monthly ad spend plays a critical role in selecting the right tool. For budgets under $10,000 per month, free tools like Flyweel or basic scheduled reports might suffice. Spending between $10,000 and $50,000 justifies investing in tools like Cometly (starting at $129/month) or visual dashboards from Databox ($47/month). For larger budgets - $50,000 to $200,000 per month - platforms like Ryze AI or advanced attribution systems like Hyros ($500/month) become more suitable.
Platform compatibility is another key consideration. Ensure the tool supports all your advertising platforms, as some restrict access to "premium" connectors like TikTok or LinkedIn Ads unless you pay for higher pricing tiers. Additionally, decide where your data should be stored - whether that's Google Sheets, a business intelligence tool like Power BI, or a dedicated data warehouse.
Your team’s technical expertise also matters. No-code solutions like Supermetrics or Flyweel are ideal for teams lacking developers. Standardizing attribution windows (e.g., a 7-day click) across platforms ensures consistent and accurate comparisons. Businesses adopting multi-platform attribution tools often see a 23–35% improvement in ROAS within two months.
Using the Marketing Analytics Tools Directory
To simplify your decision-making process, the Marketing Analytics Tools Directory (https://topanalyticstools.com) can be a valuable resource. It allows you to compare solutions side-by-side based on your specific needs, such as real-time analytics, campaign performance tracking, or integration with business intelligence platforms.
The directory helps you filter tools by features like server-side tracking, API connector counts, and pricing tiers. This is especially helpful given that 73% of customer journeys now span three or more advertising touchpoints, making tool selection increasingly complex. You can explore both established tools and newer options, read detailed feature breakdowns, and find solutions that align with your budget and technical requirements.
For agencies managing multiple clients or businesses scaling their ad spend, this directory can save significant time. Marketers, on average, spend 37% of their workweek on reporting and analysis tasks. By centralizing tool information, the directory not only speeds up decision-making but also helps prevent the 26% budget waste attributed to inadequate tracking systems.
Step-by-Step Setup Guide
Create a Master Tracking Sheet
Start by choosing a tool like Google Sheets, Excel, or Looker Studio to serve as your central hub for all ad spend data. This will be your go-to source for tracking and analyzing performance across platforms like Google Ads, Meta, TikTok, and LinkedIn. Set up a "Summary" tab for high-level metrics and create individual tabs for raw data from each platform.
To keep everything consistent, normalize the data. For example, while LinkedIn uses "Total Spent", TikTok calls it "Cash Spend", and Meta refers to it as "Amount Spent." Map all these to a single "Cost" column in your master sheet. Before diving into the details, break your annual budget into monthly, weekly, and daily limits to account for fluctuations, especially during peak seasons like Q4.
Add columns for both "Platform Spend" (as reported by the ad dashboards) and "Card Charges" (the actual amount hitting your account). These often don’t match due to billing cycles and pending charges. If you’re running international campaigns, use a consistent exchange rate to ensure accuracy across platforms. Automating data entry can save time and reduce errors, so integrating automation tools is the next logical step.
Integrate Tools Like Dataslayer
Automation is key to resolving issues like data latency and inconsistencies.
Start by installing Dataslayer from your platform’s marketplace. Use OAuth to authenticate each ad platform - Google Ads, Meta, LinkedIn, TikTok - so the tool can pull data directly from their APIs. Configure your queries to include metrics like Cost, Clicks, Impressions, and Conversions, along with dimensions such as Date and Campaign Name. Ensure all platforms use the same time zone and attribution window.
Set up automated data refreshes - daily at 6:00 AM is a good starting point, but hourly updates may be better if you’re actively managing campaigns. For instance, a DTC fashion brand managing $40,000 in monthly ad spend implemented Dataslayer and BigQuery over six months, saving 25 hours per month on manual exports. Automation revealed that Meta’s actual ROAS was 2.1× instead of the 3.2× reported in-platform, prompting them to shift $8,000 per month to Google Shopping. The brand’s CMO summed it up perfectly:
"We thought we needed a data analyst. We just needed our data in one place." - CMO, DTC Fashion Brand
Build a Summary Dashboard
Once your master sheet and automated data imports are set, it’s time to create a dashboard that delivers actionable insights at a glance. This dashboard will replace slow, manual reporting with real-time clarity.
Use formulas to aggregate and cross-check metrics like total spend, conversions, and blended ROAS. Create a table that shows platform spend, date, and cost per conversion, making it easy to spot anomalies. To calculate "Blended ROAS", divide total backend revenue by total ad spend across platforms. This gives a more accurate picture of overall performance than relying on individual platform reports.
Set up alerts for anomalies, such as when daily spend or conversions deviate by more than 50% from historical averages. If you’re using a data warehouse like BigQuery, SQL "UNION ALL" commands can merge data from various platforms into a single view, simplifying your dashboard setup. Companies that implement cross-channel attribution typically see a 15–20% improvement in budget efficiency within 90 days.
Your dashboard should include an Executive Summary page highlighting key trends like Blended ROAS and Total Spend vs. Revenue. Add a Platform Comparison page for side-by-side metrics like Spend, CPA, and ROAS, and a Campaign Drill-Down page with a sortable table of all campaigns across platforms. Research shows that nearly 50% of marketers misallocate at least 20% of their ad budgets due to poor tracking. Companies where CFOs and CMOs align on visibility are 3.5 times more likely to excel in revenue growth.
Maintaining and Optimizing Your Setup
Regular Data Validation
Make sure to assign a dedicated tracking owner. Without someone in charge, agencies often find that 8–15% of conversions end up misattributed. This person should compare platform spending with card charges or invoices from your finance team at least weekly. Discrepancies can pop up due to pending charges, refunds, or promotional credits that haven’t cleared yet.
Check your Event Match Quality (EMQ) scores monthly on social media analytics platforms like Meta. A score above 6/10 is typically needed for reliable algorithm performance. Also, keep an eye on your UTM naming conventions to avoid fragmented or messy reporting.
Here’s a real-world example: In April 2026, a $5M DTC brand working with AnyTrack found a 50% discrepancy between Meta conversions and Shopify orders. An audit revealed four problems - a duplicate Meta Pixel, a checkout process on an unlinked subdomain, UTMs being stripped during a payment redirect, and missing tracking tags on product pages. Fixing these issues brought the data discrepancy down to just 4%.
With validated data in place, you can confidently set spending thresholds and automate alerts to catch any issues early.
Set Budget Alerts
Once your data tracking is accurate, set up automated alerts to flag spending deviations of more than ±15% from expected pacing. This threshold is high enough to filter out daily fluctuations but will catch significant problems before they drain your budget. For new campaigns, check pacing daily during the first week, every 2–3 days in weeks two through four, and weekly once the campaign stabilizes.
You can use tools like Google Ads' automated rules or third-party platforms to set up notifications via email or Slack. For example, you might trigger an alert if your daily spend exceeds $500 or if your CPA rises by 20%. For B2B campaigns that slow down on weekends, calculate pacing based on business days to avoid false underperformance signals.
Once your alerts are in place, you can shift your focus to refining your tracking and optimization methods.
Continuous Optimization
With validated data and budget alerts working in your favor, you can focus on fine-tuning your setup. Retain at least 12 months of historical data when switching automation tools to ensure you have year-over-year comparisons without gaps. Additionally, include a "Credits/Adjustments" column in your reporting to accurately account for promotional credits and refunds.
To recover 20–30% of conversions lost to ad blockers or browser privacy settings, consider moving to server-side tracking. Also, make sure the revenue reported to ad platforms reflects the net value - excluding VAT and shipping costs. This ensures your ROAS calculations aren’t artificially inflated.
Conclusion
Benefits of Automation
Automating ad spend tracking can save a ton of time that would otherwise be spent copying data into spreadsheets every month. For example, if a marketer earns $50 per hour, automation can save around $400 in labor costs in just the first month. But it’s not just about saving time - automated systems also deliver 95–99% data accuracy, compared to the 70–85% accuracy that comes with manual exports. This means fewer errors that could throw off your budget allocation.
Another big win? Unified visibility across all your ad channels. Instead of dealing with fragmented reports from platforms like Google, Meta, TikTok, and LinkedIn - which can inflate conversions by up to 35% through self-attribution - automation gives you a single, reliable source of truth. With normalized metrics and currencies, you can easily spot and cut the 26% of budgets that marketers typically waste on underperforming channels. Plus, companies where CFOs and CMOs align on spend data are 3.5 times more likely to see stronger revenue growth. So, automation isn’t just about saving time - it’s a strategic move that can directly impact your bottom line.
"If we don't trust the data, the agency won't trust the reports and won't give them to the client... With Improvado, we now trust the data. It's 99.9% accurate."
- Tyler Corcoran, Marketing Analytics Manager, Booyah Advertising
Getting Started with Automation
Now that the benefits are clear, here’s how to get started with automation. Begin by auditing your pixels, conversion events, and attribution models to identify any gaps. Consolidating your tracking processes will address inefficiencies and ensure your data is as reliable as possible. Don’t forget the importance of standardizing a 7-day click window across all platforms to make performance comparisons valid.
If you’re unsure which tool fits your budget or technical needs, check out the Marketing Analytics Tools Directory at https://topanalyticstools.com. It’s a great resource to help you compare solutions and find the perfect fit for your team.
FAQs
Which attribution window should I standardize on across platforms?
The best attribution window varies based on your marketing objectives and how long your sales process typically takes. A 7-day click window is a popular choice because it strikes a balance between capturing recent conversions and aligning with platform defaults, like Meta's. However, if your sales cycle is longer, you might need to extend the window - sometimes up to 90 days - to better reflect your customer journey. The most important thing? Pick a timeframe that mirrors how your customers make decisions and stick to it across all platforms to ensure consistent and accurate tracking.
How do I reconcile platform spend with actual card charges?
To keep your finances in check, it's important to match the ad spend reported by each platform with your bank or credit card statements. Here's how you can do it:
- Export Spend Data: Start by downloading the spend reports from each advertising platform you use.
- Compare Totals: Cross-check these totals against your bank or credit card statements to ensure they align.
- Use Automation Tools: Simplify the process by leveraging automation tools or accounting templates designed for this purpose.
Making this a regular habit can help you maintain accurate financial records, avoid overspending, and stay on top of your ad budgets.
Do I need server-side tracking for accurate ROAS?
Server-side tracking offers a powerful way to improve the accuracy of ROAS by recovering 20–30% of conversions that browser-based pixels might miss. This happens because browser pixels often face challenges like ad blockers and iOS restrictions. Additionally, server-side tracking ensures more consistent data collection, especially for campaigns running across multiple platforms. While it's not a requirement for basic tracking, it’s highly recommended if you want precise ROAS measurements and deeper insights into your campaign's profitability.