Balancing speed and precision in real-time analytics is a key challenge for businesses. Faster data processing often sacrifices accuracy, while ensuring precision can slow down decision-making. Here’s how to find the right balance:
- Understand your needs: Different tasks have different latency and accuracy requirements. For example, fraud detection needs sub-second responses, while weekly reports can tolerate delays.
- Set clear thresholds: Define acceptable latency and accuracy levels for each process. Use tiered latency models (e.g., sub-second for critical tasks, minutes for operational needs).
- Optimize systems: Use techniques like model quantization, structured pruning, and hybrid architectures to speed up processing without compromising accuracy.
- Upgrade infrastructure: Leverage edge computing, caching, and load balancing to cut delays and ensure data freshness.
- Monitor performance: Track key metrics (e.g., P50, P90, P99 latency) and adjust systems dynamically to maintain balance under varying conditions.
Bottom line: The goal isn’t just speed - it’s delivering accurate, timely insights tailored to your business needs. By combining the right strategies, real-time analytics tools, and ongoing monitoring, you can build analytics systems that perform efficiently without sacrificing reliability.
Accuracy vs Latency
sbb-itb-5174ba0
Assess Your Analytics Requirements
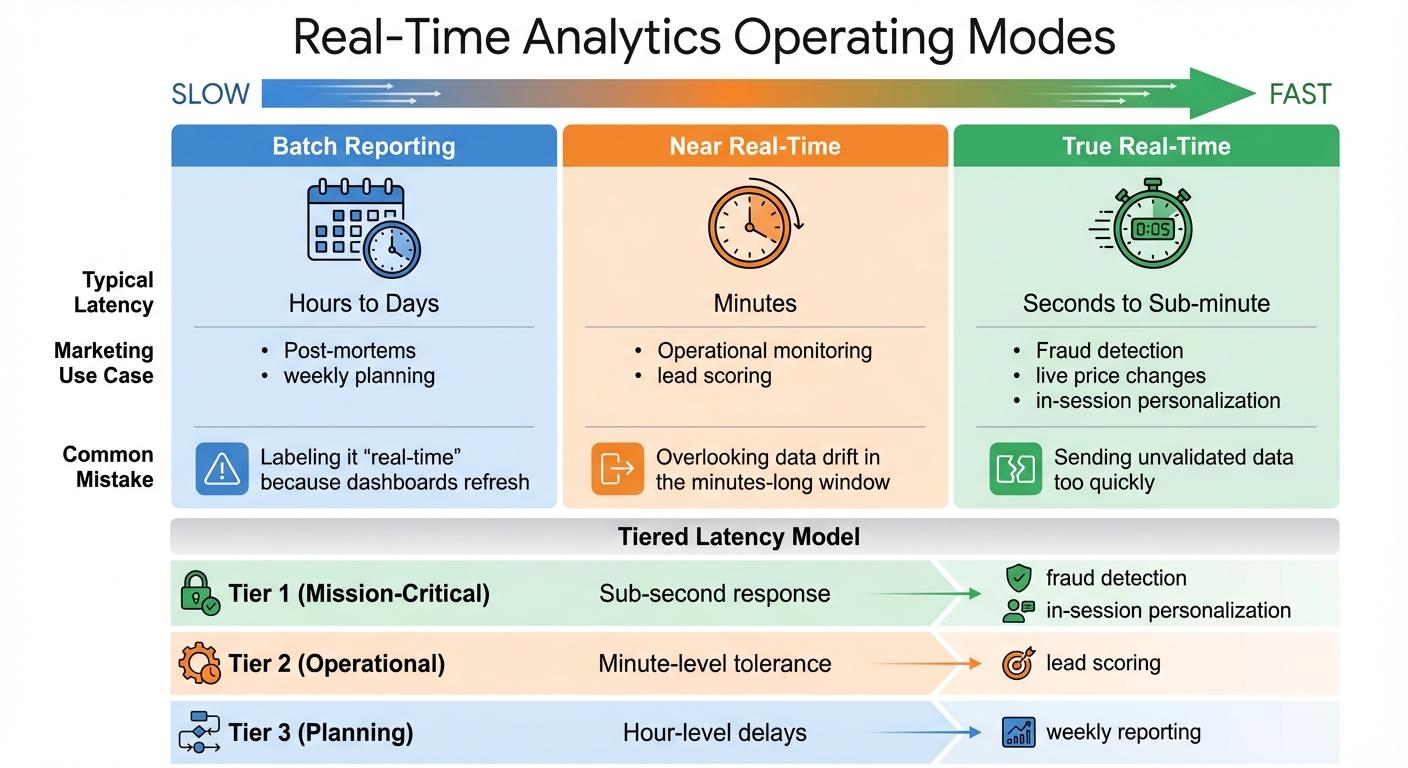
Real-Time Analytics Operating Modes: Latency Requirements and Use Cases
Understanding your analytics needs starts with identifying the business decisions that shape them. For example, in-session personalization requires split-second responses, while weekly campaign reports can handle longer delays. The trick is to align your technical setup with the urgency of the decision-making process. Once that's clear, you can set latency goals and evaluate your current system to create a focused improvement plan.
Define Target Latency and Accuracy Thresholds
Start by pinpointing which processes falter when data arrives late. In the ad-tech world, a 10–15 minute delay might be acceptable for campaign tweaks, but fraud detection demands responses in under a minute. Similarly, marketing teams using dynamic content or AI-driven recommendations work within even tighter windows. Dan George from Tealium explains it well:
"The ability to influence a decision to buy is measured in seconds, not minutes. When action happens after the session ends, you're not engaging a customer - you're retargeting a ghost".
Be cautious of platforms that claim "real-time" capabilities but rely on 15-minute micro-batches. To illustrate true real-time performance, Tealium, in February 2026, showcased a complete data processing cycle - from JavaScript SDK loading to AWS Lambda processing and profile activation - in just 600 milliseconds. That’s the gold standard for real-time personalization.
To manage varying speed requirements, create tiered latency models:
- Tier 1 (Mission-Critical): Sub-second response for tasks like fraud detection or in-session personalization.
- Tier 2 (Operational): Minute-level tolerance for activities like lead scoring.
- Tier 3 (Planning): Hour-level delays for tasks such as weekly reporting.
This approach ensures you prioritize critical workflows without over-engineering systems that don’t need instant data.
| Operating Mode | Typical Latency | Marketing Use Case | Common Mistake |
|---|---|---|---|
| Batch Reporting | Hours to Days | Post-mortems, weekly planning | Labeling it "real-time" because dashboards refresh |
| Near Real-Time | Minutes | Operational monitoring, lead scoring | Overlooking data drift in the minutes-long window |
| True Real-Time | Seconds to Sub-minute | Fraud detection, live price changes, in-session personalization | Sending unvalidated data too quickly |
Once you've set these thresholds, evaluate your system’s performance to identify areas that need improvement.
Analyze Current System Performance
With your latency goals in place, examine your data pipeline to locate bottlenecks. Focus on four key stages: event-time (when data is created), ingest-time (when it's collected), process-time (when it's transformed), and serve-time (when it's ready for use). By comparing timestamps between these stages, you can zero in on problem areas.
For streaming systems like Kafka or Kinesis, keep an eye on metrics like "iterator age" or consumer group lag to determine if your system can keep up with data ingestion. For example, Dialpad reduced ingestion latencies from over a minute to just 10 milliseconds by using optimized indexing and upsert strategies. Achieving such improvements requires thorough profiling to identify choke points.
To catch outliers that could harm the user experience, rely on percentile-based SLAs (p50, p90, p99) rather than averages. Tools like OpenTelemetry can help you trace delays across stages, revealing specific bottlenecks or retries in complex pipelines. The goal is to not just know that your system is slow but to understand where and why it’s lagging.
If you’re exploring tools to aid this analysis, check out platforms in the Marketing Analytics Tools Directory. They can help you compare solutions for real-time analytics, reporting dashboards, and business intelligence tools tailored to different latency and accuracy needs.
Techniques to Balance Latency and Accuracy
Once you've pinpointed the slowdowns in your system, the next step is to apply techniques that improve speed without compromising precision. Below are methods designed to optimize performance while maintaining quality.
Implement Model Optimization Methods
To balance latency and accuracy, fine-tune your models by adjusting their structure and precision. Model quantization is one way to achieve this by reducing numerical precision - like converting 32-bit floating-point numbers (FP32) to 8-bit integers (INT8) or even 4-bit formats (INT4). This can shrink model size by up to 75% and speed up inference by 2–4x. For instance, in December 2025, NVIDIA showed that its TensorRT compiler could achieve INT8 quantization for ResNet-50 with less than a 1% accuracy drop while cutting latency by 71%.
For quick compression, Post-Training Quantization (PTQ) uses a calibration dataset and skips retraining. If accuracy dips below your service level agreement (SLA), Quantization-Aware Training (QAT) can restore precision through a fine-tuning phase. In late 2025, Meta AI used QAT on its recommendation models, retaining 99.5% of FP32 accuracy while boosting throughput by 3.5x. For tasks needing extreme latency cuts, Quantization-Aware Distillation (QAD) aligns a student model with a full-precision teacher model, recovering even more accuracy.
Another method is structured pruning, which removes entire components like channels or attention heads, creating smaller models that can run on standard hardware. A great example is Microsoft Research's DynaBeRT, which pruned 75% of attention heads in a BERT-base model while keeping 97% of its original accuracy. For large language models, speculative decoding uses a smaller model to generate initial tokens, with a larger model verifying them. This approach can deliver 2–3x throughput without altering weights.
Eduardo Alvarez, Senior Technical Lead at NVIDIA, highlights the benefits of speculative decoding:
"Speculative decoding is recommended when you want immediate generation speedups without retraining or quantization".
If you're unsure where to start, try INT8 PTQ for a quick and easy improvement. If accuracy doesn't meet your SLA, move on to QAT. For tasks requiring ultra-low precision, QAD is your best bet.
| Method | Accuracy Recovery | Implementation Complexity | Best Use Case |
|---|---|---|---|
| PTQ | Low to Moderate | Low (Minutes) | Fast deployment, large models |
| QAT | High | Moderate (Requires retraining) | Accuracy-critical tasks |
| QAD | Highest | High (Complex pipeline) | Ultra-low precision tasks |
| Pruning | Variable | Moderate to High | Structural cost and memory savings |
Adopt Adaptive and Hybrid Systems
Beyond optimizing individual models, adaptive and hybrid systems can further improve performance by tailoring resources based on task complexity. Adaptive frameworks handle simple requests with lightweight models, saving full-power processing for more demanding cases. This approach directly addresses the latency-accuracy trade-offs discussed earlier.
Hybrid architectures use tiered processing to balance speed and precision. A fast, lower-accuracy algorithm handles initial requests, providing quick feedback, while a slower, high-accuracy process refines the results in the background. This is known as Lambda Architecture, where a "Speed Layer" delivers low-latency approximate views, and a "Batch Layer" computes authoritative results. Twitter processes over 400 billion events daily using this model.
Consistency between layers is crucial. A 2016 LinkedIn audit revealed that 23 metrics drifted by 4% to 8% over six months due to inconsistent logic between speed and batch layers. To avoid this, use shared transformation libraries to ensure both layers run identical code. The serving layer should also use "batch-wins" semantics, replacing approximate speed-layer results with accurate batch-layer outputs once processing is complete.
For large language models, prioritizing Time to First Token (TTFT) can make systems feel more responsive. This streaming approach shows results immediately while the model continues generating in the background, balancing speed and thoroughness.
When implementing hybrid systems, monitor the "speed-to-batch divergence rate." If it exceeds 0.5%, it's a sign that your logic has drifted and needs adjustment.
These strategies lay the groundwork for even greater latency reductions through future infrastructure improvements.
Optimize Infrastructure for Real-Time Analytics
Once you've fine-tuned your models and integrated responsive systems, the next step is to enhance your infrastructure. A carefully designed architecture can significantly cut down on latency by processing data closer to users and efficiently distributing workloads.
Use Edge Computing and Proximity Servers
Edge computing brings processing closer to users, enabling decisions to be made in under 100 milliseconds. By performing lightweight tasks like feature extraction locally and offloading more intensive operations to regional GPU clusters, latency is minimized. This approach is especially critical for real-time marketing analytics and safety checks, where sub-100ms latency is often mandatory.
A practical example: In early 2026, a mid-size payment processor transitioned from 30-minute batch features to sub-second streaming features. The result? Fraud detection accuracy jumped from 91% to 97.3%, all without altering the AI model itself.
Alex Kimball, formerly of Cockroach Labs, highlights the importance of timely data:
"Real-time artificial intelligence is defined by data freshness at inference time, not model response speed. A model that responds in 10ms using features from an hour ago is fast, but it is not real-time artificial intelligence".
To further optimize, use deterministic routing to direct users to a single host, which reduces coordination delays and ensures event order. For distributed systems, cryptographic attestations can validate function origins across edge nodes, enhancing data security and accuracy. Additionally, tagging metadata from edge nodes improves observability and simplifies debugging.
Add Caching and Load Balancing
Caching data and distributing workloads effectively can reduce latency, ease database loads, and cut cloud expenses. A multi-level caching strategy works best:
- L0 (Edge/CDN): For static assets.
- L1 (In-process): For high-demand keys.
- L2 (Distributed): For persistent data.
By placing frequently accessed, stable data in higher cache levels, you can ensure faster access. To balance performance and costs, use tiered storage - keep "hot" data on fast storage and move "cold" data to cost-effective object storage.
Real-time analytical databases can see major latency reductions with optimized indexing and upsert strategies. Actively managing Time-to-Live (TTL) settings helps prevent issues like stale data and thundering herd outages. Adaptive timeouts, based on historical p99 latency metrics, can replace fixed timeout values, avoiding unnecessary system blocks. Additionally, defining and tracking Service Level Objectives (SLOs) for p99 latency ensures consistent performance before, during, and after system updates.
For load balancing, backpressure and client hints can guide clients when servers are overloaded, helping maintain stability through throttling. A notable success story: Uber saved over 50% in infrastructure costs in early 2026 by adopting a real-time database tailored for low-latency, high-concurrency workloads, ditching less efficient batch-processing tools.
These strategies lay the groundwork for ongoing performance tuning and monitoring, ensuring your infrastructure is ready to handle the demands of real-time analytics.
Monitor and Fine-Tune Performance
Once you've optimized your model and made infrastructure upgrades, the work doesn’t stop there. To keep your system running smoothly, you need to monitor its performance regularly. As data volumes grow, user behaviors shift, and business needs change, these adjustments ensure that latency and accuracy remain balanced. With consistent tracking, you can catch issues early and make smart decisions about where to focus your efforts.
Track Metrics and Trade-Offs
Start by measuring three key types of latency: processing latency, source queuing latency, and end-to-end latency. Together, these metrics highlight bottlenecks in your pipeline.
Pay special attention to percentile-based tracking - it’s far more revealing than averages. Why? Averages can mask performance issues. For example, a system with an average latency of 50ms might still have a P99 latency of 2 seconds, which could frustrate users during high-traffic periods. To fully understand variability and worst-case scenarios, monitor P50, P90, P95, and P99 metrics.
Dmitri Koteshov from Mitrix Technology puts it plainly:
"In many real-time contexts, a marginal reduction in prediction quality is acceptable if it yields a significant latency benefit".
This idea of "sufficient accuracy" is key. As you adjust latency targets, track how accuracy metrics shift. Find the sweet spot where further latency improvements aren’t worth the trade-off in accuracy.
To automate monitoring, use tools like StreamingQueryListener to log progress and send metrics to external systems. For end-to-end latency, consider implementing an "Observe API." This API can record a timestamp when data arrives and calculate the delay just before it exits the pipeline. Additionally, you can cut down inter-batch time in stateless queries by moving offset and commit log writes to an asynchronous thread.
When testing your system, always benchmark under realistic conditions. Using actual data volumes will expose how hardware factors - like memory bandwidth and cache efficiency - affect performance. You can also use dynamic thresholds to adapt to system load. For example, during latency spikes, you might relax validation rules or switch to simpler models to keep things running smoothly.
These metrics and strategies give you the foundation for deeper analysis and performance refinement.
Use Comparative Analysis Tools
The Marketing Analytics Tools Directory is a great resource for comparing tools that support real-time analytics, business intelligence, and reporting dashboards. Whether you’re tracking latency metrics, monitoring campaigns, or setting up advanced workflows, this directory can help you find solutions tailored to your needs - whether you're a small business or an enterprise.
When choosing tools, focus on those with built-in latency tracking for all three key measurement types. Platforms that support percentile-based reporting are especially valuable. Also, look for features like watermark tuning, which lets you adjust how long the system waits for late-arriving data. While wider watermarks improve accuracy for delayed events, they also increase result latency. Tools with dead-letter topic support are another must-have - they ensure that invalid messages won’t clog up your entire pipeline.
If you’re just starting out, consider managed services. These platforms handle scaling and infrastructure maintenance for you, so your team can focus on fine-tuning system performance instead of wrestling with operations. The right tools should align with your latency and accuracy goals while offering the visibility you need for ongoing adjustments.
Conclusion
Balancing latency and accuracy is a critical decision that shapes real-time business performance. The framework outlined here equips you to navigate this balance effectively.
With a clear strategy, actionable steps can ensure your system delivers on its goals. Set specific latency targets that align with business priorities - fraud detection and industrial safety demand sub-second responses, whereas marketing attribution can handle delays of a few minutes. Simplify models through pruning and quantization to maintain efficiency without sacrificing essential accuracy. Consider adopting a hybrid architecture, such as combining a real-time OLAP store for instant dashboards with a lakehouse for long-term data management, which is emerging as a best practice for 2026.
To address network delays, leverage edge computing, caching, and load balancing. Keep in mind: inaccurate data delivered quickly can be more damaging than accurate data delivered slightly slower. These optimizations enhance your real-time analytics, ensuring insights are both timely and trustworthy. Incorporate fail-safes, mandatory field validations, and drift detection from the start to safeguard against large-scale errors.
Continuous monitoring is where the real work happens. Track latency metrics like P50, P90, and P99 alongside accuracy to detect issues early. Use dynamic thresholds that adjust to system load, and be prepared to relax validation rules or switch to simpler models during high-traffic periods. Tools such as the Marketing Analytics Tools Directory can assist in evaluating platforms with features like latency tracking, percentile reporting, and watermark tuning.
The ultimate goal isn’t just speed - it’s finding the right speed that aligns with your business objectives. By viewing latency and accuracy as strategic tools rather than technical challenges, you can create real-time analytics systems that deliver impactful results when they’re needed most.
FAQs
How do I choose the right latency target for each use case?
When defining the ideal latency target for real-time analytics, it’s essential to align it with your application's specific requirements and the trade-offs you're willing to accept. For instance, tasks like anomaly detection demand extremely low latency - measured in seconds or even milliseconds - so you can respond swiftly. On the other hand, activities like trend analysis or reporting can often handle latency in the range of a few minutes, allowing you to prioritize accuracy over speed.
To make the best decision, consider several factors: the volume of data your system processes, the experience level of your team, and how scalable your infrastructure is. These elements will help you strike the right balance between performance and practicality.
What’s the fastest way to reduce model latency without losing accuracy?
To keep response times low without compromising accuracy, focus on refining model architecture and routing methods. One effective strategy is to use smaller, task-specific models for straightforward queries, while saving larger, more advanced models for scenarios that require complex reasoning. Another helpful technique is implementing semantic caching, which can reduce response times by reusing previously computed results. Additionally, self-hosting your models can remove network-related delays altogether. Together, these methods can boost speed while ensuring accuracy remains intact.
How can I measure end-to-end latency and spot the real bottleneck?
To get a clear picture of end-to-end latency and spot bottlenecks, Application Performance Monitoring (APM) tracing is your go-to tool. It follows a request's entire execution path, recording timestamps, durations, and contextual details for every step. By diving into latency metrics for specific components and keeping an eye on how data flows through your system, you can zero in on delays - whether they occur during capture, transport, processing, or storage. This makes it easier to focus improvements on the areas causing the most slowdown.