If you need to find why users drop off - not just where - these 9 tools split into 5 clear groups. I’d use Mixpanel or Amplitude for event analysis, Heap or Pendo for autocapture and in-product action, Hotjar or Microsoft Clarity for visual UX checks, FullStory or LogRocket for replay plus debugging, and Quantum Metric for large enterprise monitoring.
In plain terms, the choice comes down to 3 things:
- How data is collected - manual event setup vs. autocapture
- What you need to learn - funnels, retention, heatmaps, replay, errors, or revenue impact
- What you can spend - from free forever with Clarity to custom enterprise contracts
A few fast takeaways:
- Best free option: Microsoft Clarity - free, no traffic cap, web-only
- Best for product analytics: Amplitude or Mixpanel
- Best for fast autocapture: Heap
- Best for UX research: Hotjar
- Best for replay search: FullStory
- Best for engineering teams: LogRocket
- Best for enterprise monitoring: Quantum Metric
- Best for in-app guides and adoption: Pendo
Most teams do not need 1 tool to do everything. I’d usually pair 1 event analytics tool with 1 replay or heatmap tool so you can see both the metric change and the user behavior behind it.
Quick Comparison
| Tool | Main use case | Data style | Free plan | Paid starting point |
|---|---|---|---|---|
| Mixpanel | Product funnels, retention, segmentation | Manual events | Yes | $0.28 per 1,000 events after first 1M |
| Amplitude | Behavior analysis, cohorts, experiments | Manual events | Yes | About $49/month |
| Heap | Autocapture product analytics | Autocapture | Yes | About $24,000/year |
| Hotjar | Heatmaps, recordings, feedback | Visual behavior | Yes | About $99/month |
| FullStory | Replay, search, frustration analysis | Autocapture | Yes | $199/month |
| Pendo | Analytics plus in-app guidance | Autocapture + tagging | Yes | Custom quote |
| Microsoft Clarity | Free heatmaps and replay | Visual behavior | Yes - unlimited | Free forever |
| LogRocket | Replay plus errors and performance | Replay + dev data | Yes | About $31/month |
| Quantum Metric | Enterprise monitoring and revenue impact | Enterprise autocapture | No | Custom quote |
If you’re picking a tool in July 2026, this list gives you the short path: match the tool to your team’s setup, budget, and main job, then cut anything that does not fit that use case.
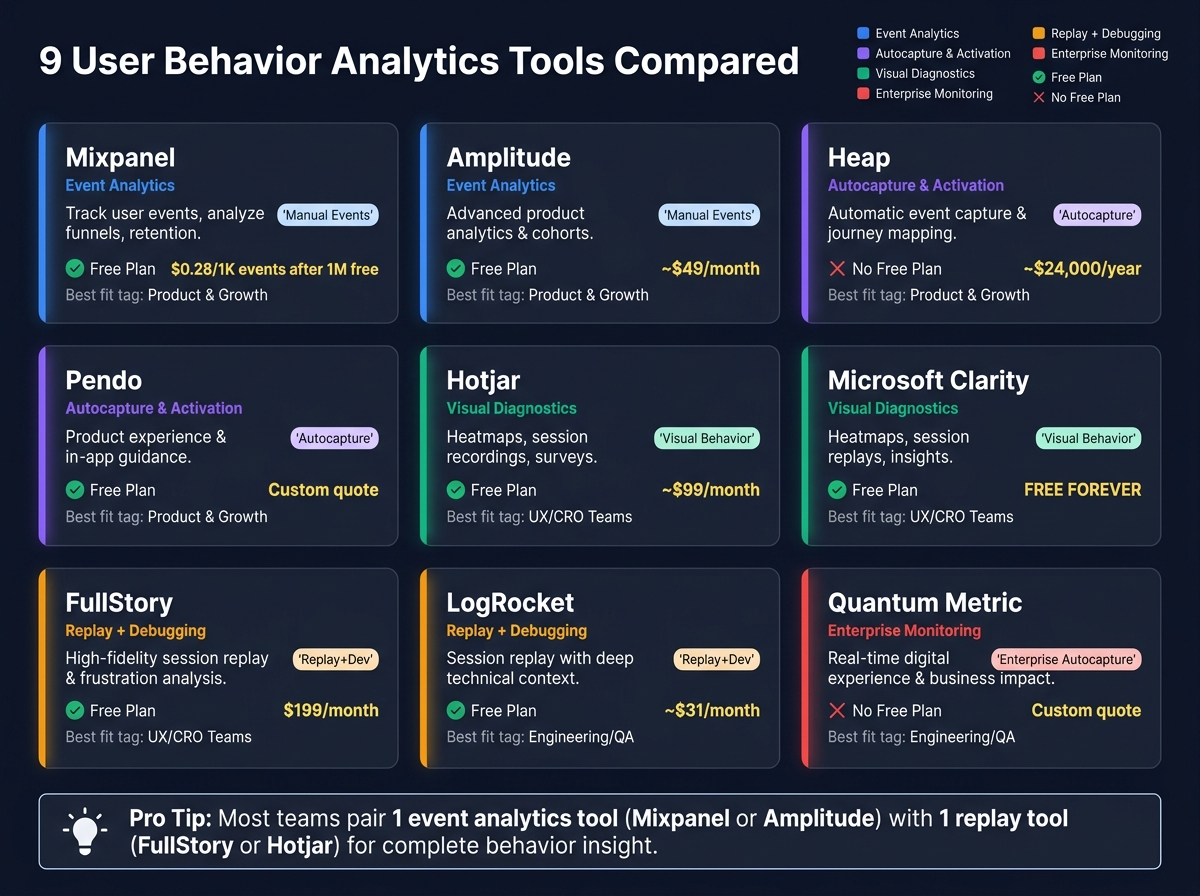
9 User Behavior Analytics Tools Compared: Features, Pricing & Best Fit
Top 11 Heatmap & User Behavior Tools 2025
sbb-itb-5174ba0
1. Mixpanel
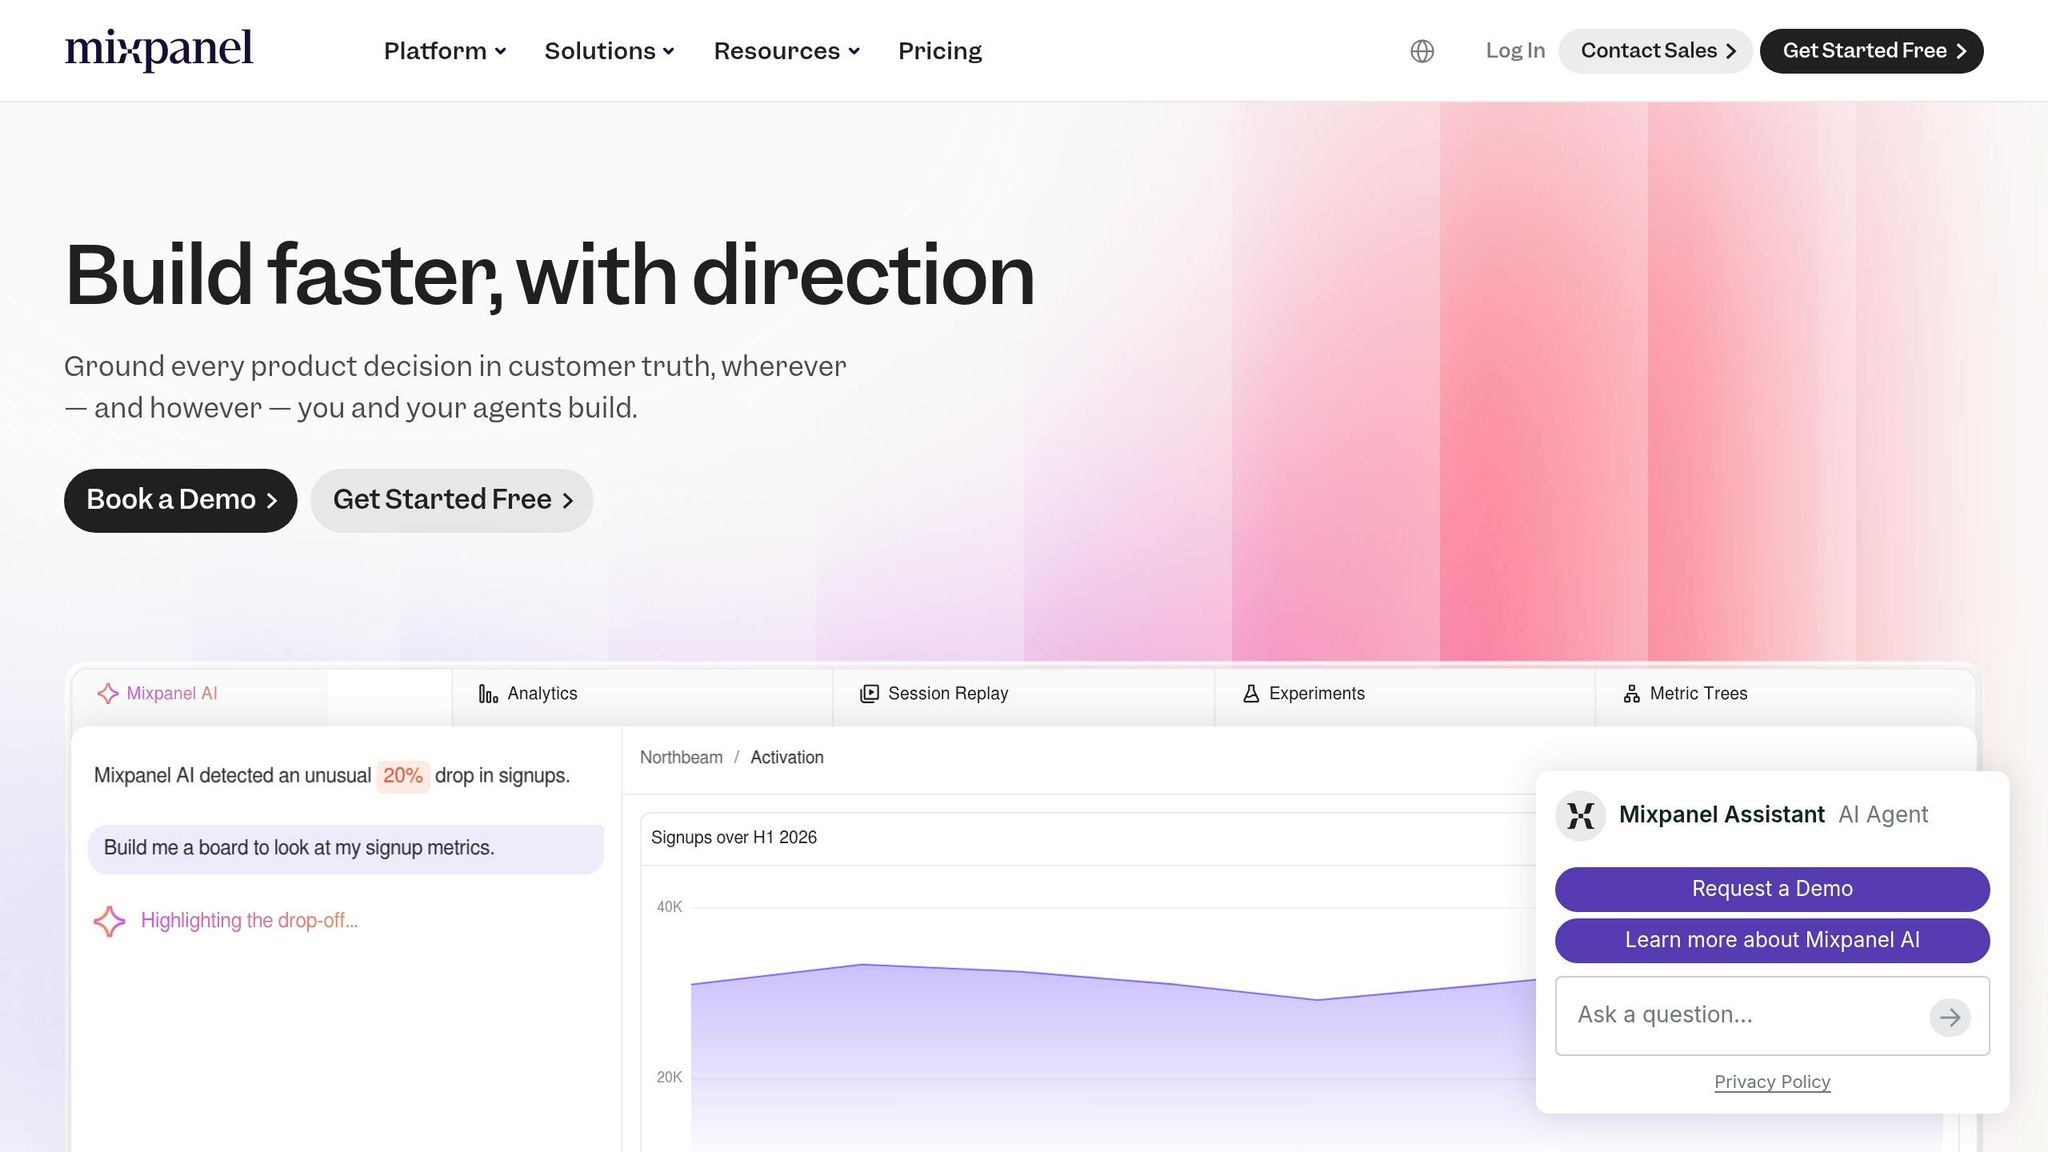
Mixpanel is built on explicit event tracking. Your team instruments clicks, screen transitions, and API calls directly. That means more work up front than autocapture, but the payoff is cleaner data over time and more dependable segmentation and retention analysis. A Forrester study reported a 354% ROI and a six-month payback period [5][7].
Tracking Depth and Data Sources
Mixpanel tracks behavioral data across website analytics tools, mobile apps on iOS and Android, and server-side API calls. It also connects with CDPs and data warehouses, which lets teams combine behavior data with things like subscription status, payment events, support tickets, and account attributes.
Lookup Tables add CRM context such as ARR band or industry. That gives teams account-level segmentation without changing tracking code, which is handy when you want richer analysis without another engineering pass.
Reporting Views and Analysis
The main report types are Insights, Funnels, Retention, and Flows. Funnel analysis is closely connected to Session Replay, so a team can click on a drop-off point and watch replays from those exact sessions right away.
Signal helps surface early behaviors that point to outcomes like 90-day retention or conversion. That’s where Mixpanel stands out: it helps teams see which actions link most closely to conversion, retention, and churn. If your team uses product data often, that extra setup can make sense. This is common when evaluating analytics tools for business to ensure data quality.
Model Support and AI Features
Mixpanel includes Spark Copilot and a Mixpanel Agent for natural-language queries on live product data. MCP connects Mixpanel with AI assistants like Claude and ChatGPT. Anomaly detection and root cause analysis are available on the Enterprise tier.
The main tradeoff is simple: Mixpanel works best when your team needs precise product data that holds up over time, not just a fast install.
Pricing
- Free: up to 1,000,000 monthly events and 10,000 session replays
- Growth: free for the first 1,000,000 events, then $0.28 per 1,000 events
- Enterprise: custom pricing
- Startup Program: startups under 5 years old with less than $8 million in funding can apply for the first year free [5][6]
Best fit: Product, growth, and analytics teams that need behavior patterns tied to downstream revenue or retention. Less suited for teams without engineering support.
Amplitude takes a similar product analytics approach, but leans more into behavioral modeling and experiment-led decision-making.
2. Amplitude
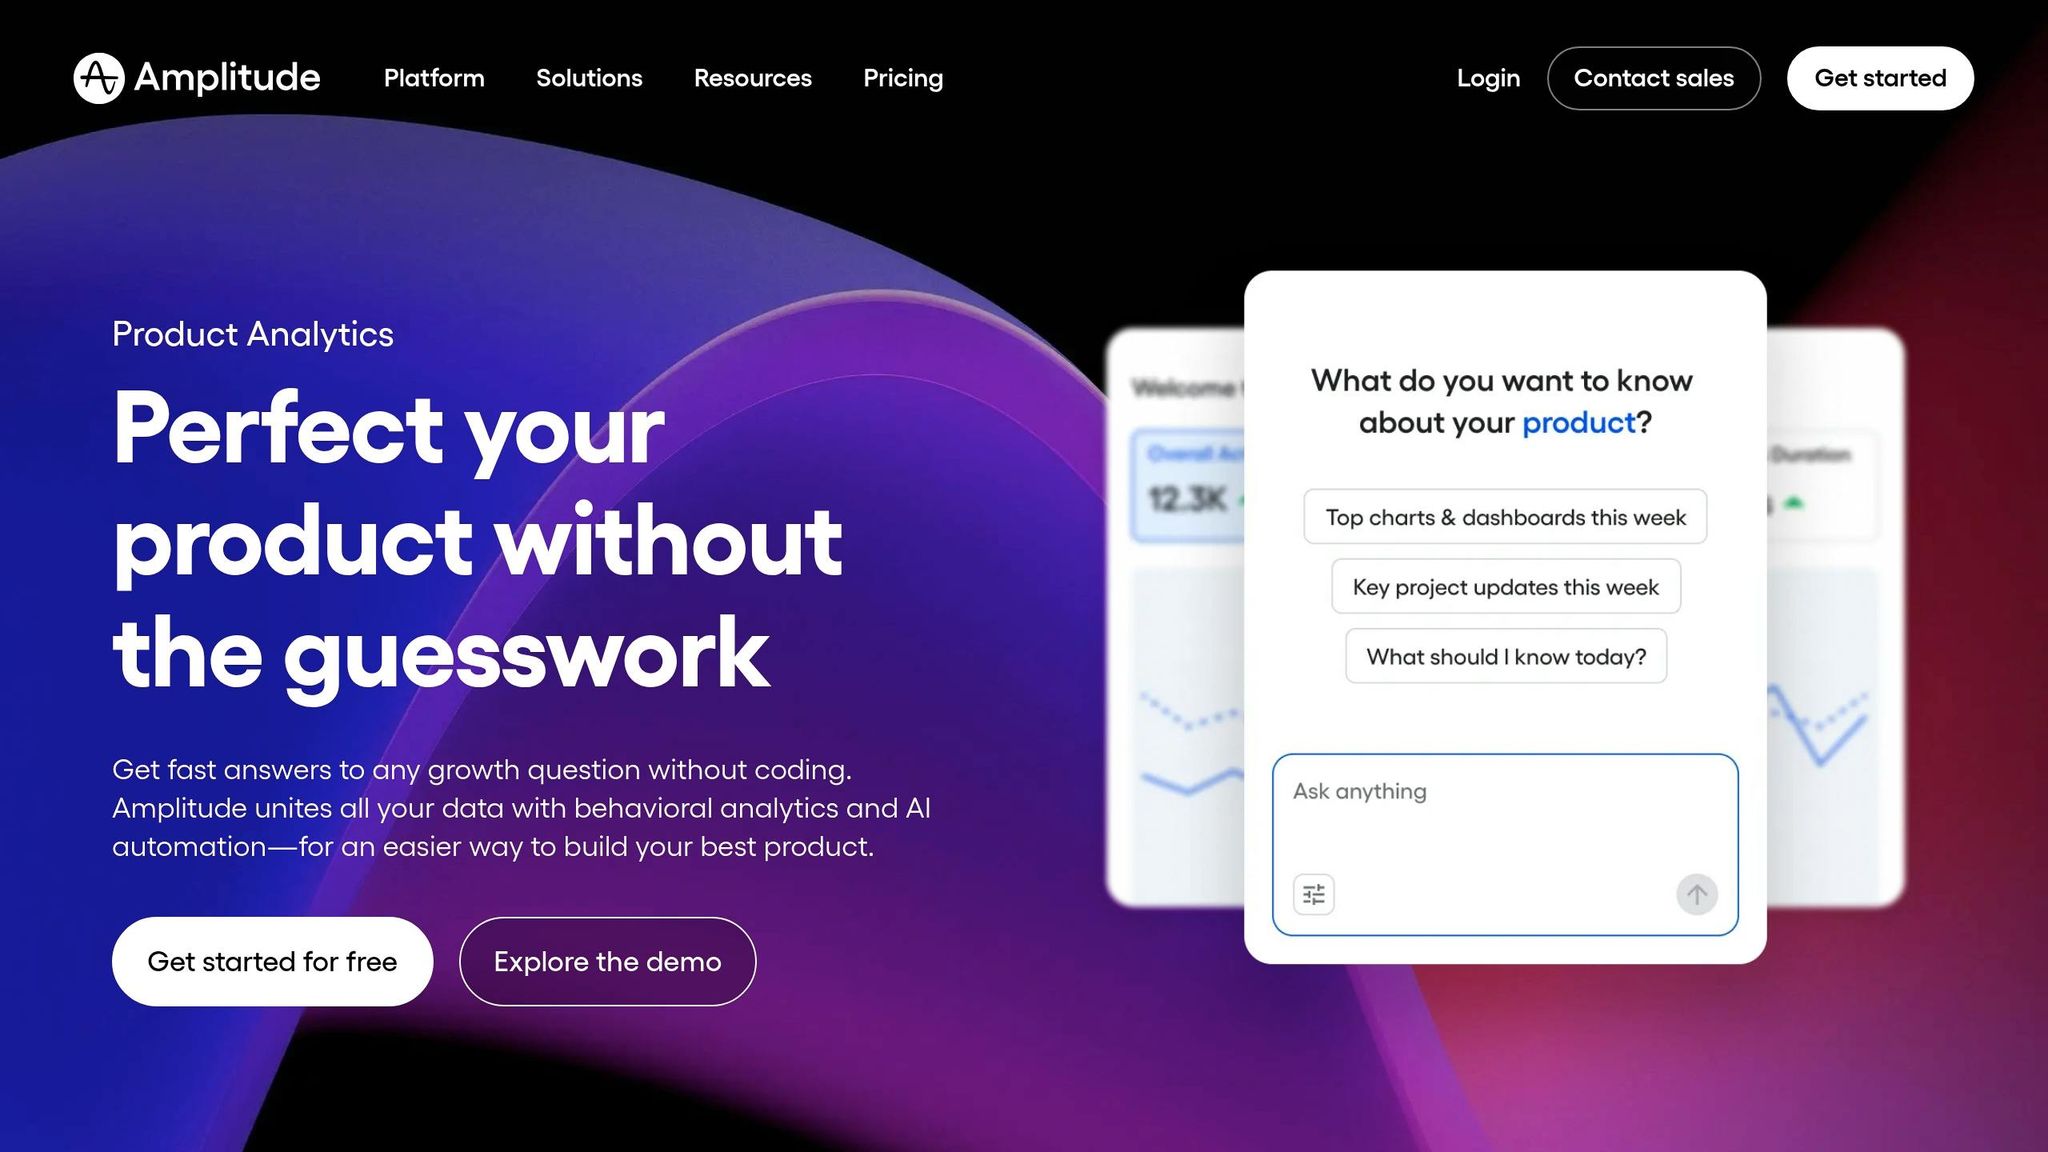
Amplitude goes deeper than Mixpanel on behavior analysis. Mixpanel leans into clean instrumentation. Amplitude adds behavior modeling, causal analysis, and experimentation to help teams dig into patterns in more detail. It’s used by more than 45,000 teams, including 23 of the Fortune 100 [8], and a commissioned study reported a 217% ROI over 3 years [11].
Tracking Depth and Data Sources
Amplitude collects data through SDKs for web, iOS, Android, React Native, and Flutter, along with server-side APIs. It also supports warehouse-native analysis, which means teams can query data straight from Snowflake, BigQuery, and Redshift instead of copying it into Amplitude first.
Its Behavioral Graph connects feature usage to business outcomes across the digital journey. In plain terms, it helps teams see how product actions tie back to results that matter.
Reporting Views and Analysis
Amplitude’s reporting tools are built to spot patterns in clicks, paths, sessions, cohorts, and repeat actions. Pathfinder and user journey mapping show the steps users take around a key event, so teams can move from sequence analysis to drop-off analysis without jumping between tools.
Funnel reports highlight cohorts that do better or worse at specific stages. In one tested workflow, Amplitude surfaced a 28% activation drop among Safari mobile users that was hidden in rolled-up data [10].
Retention reporting includes several retention views, which helps teams connect repeat behaviors with long-term engagement. Predictive cohorts use ML to flag users who are likely to churn or convert, though those models tend to work best after at least 6 months of event history [10].
Amplitude also includes a causal insights engine that tries to connect metric changes to specific product updates, not just show correlation. Session replay is built in too, so teams can inspect user behavior straight from funnel drop-off points.
Model Support and AI Features
Amplitude’s MCP Server lets teams query live behavior data in Claude or Cursor [11][8]. Its AI anomaly detection flags unusual behavior patterns and suggests likely root causes to help teams diagnose issues faster [10]. Amplitude Experiment connects A/B test results to behavior cohorts, so teams can track treatment-group behavior over time without stitching together separate tools.
Pricing
The free Starter plan supports up to 50,000 monthly tracked users and includes session replay and feature flags [8]. Paid plans start at about $49 per month for Plus, with Growth and Enterprise on custom pricing [10][4]. Buyer reports put enterprise spend at about $22,000 to $250,000+ per year [4][8].
That pricing tends to fit teams with enough product volume and engineering support to make use of a deeper behavior stack.
Best fit: Product and growth teams that want deep behavior analysis plus experimentation, and have the engineering time to build and maintain a careful event taxonomy. Amplitude is powerful, but it’s not a plug-and-play setup.
Heap takes the opposite path: it auto-captures behavior instead of relying on manual instrumentation.
3. Heap
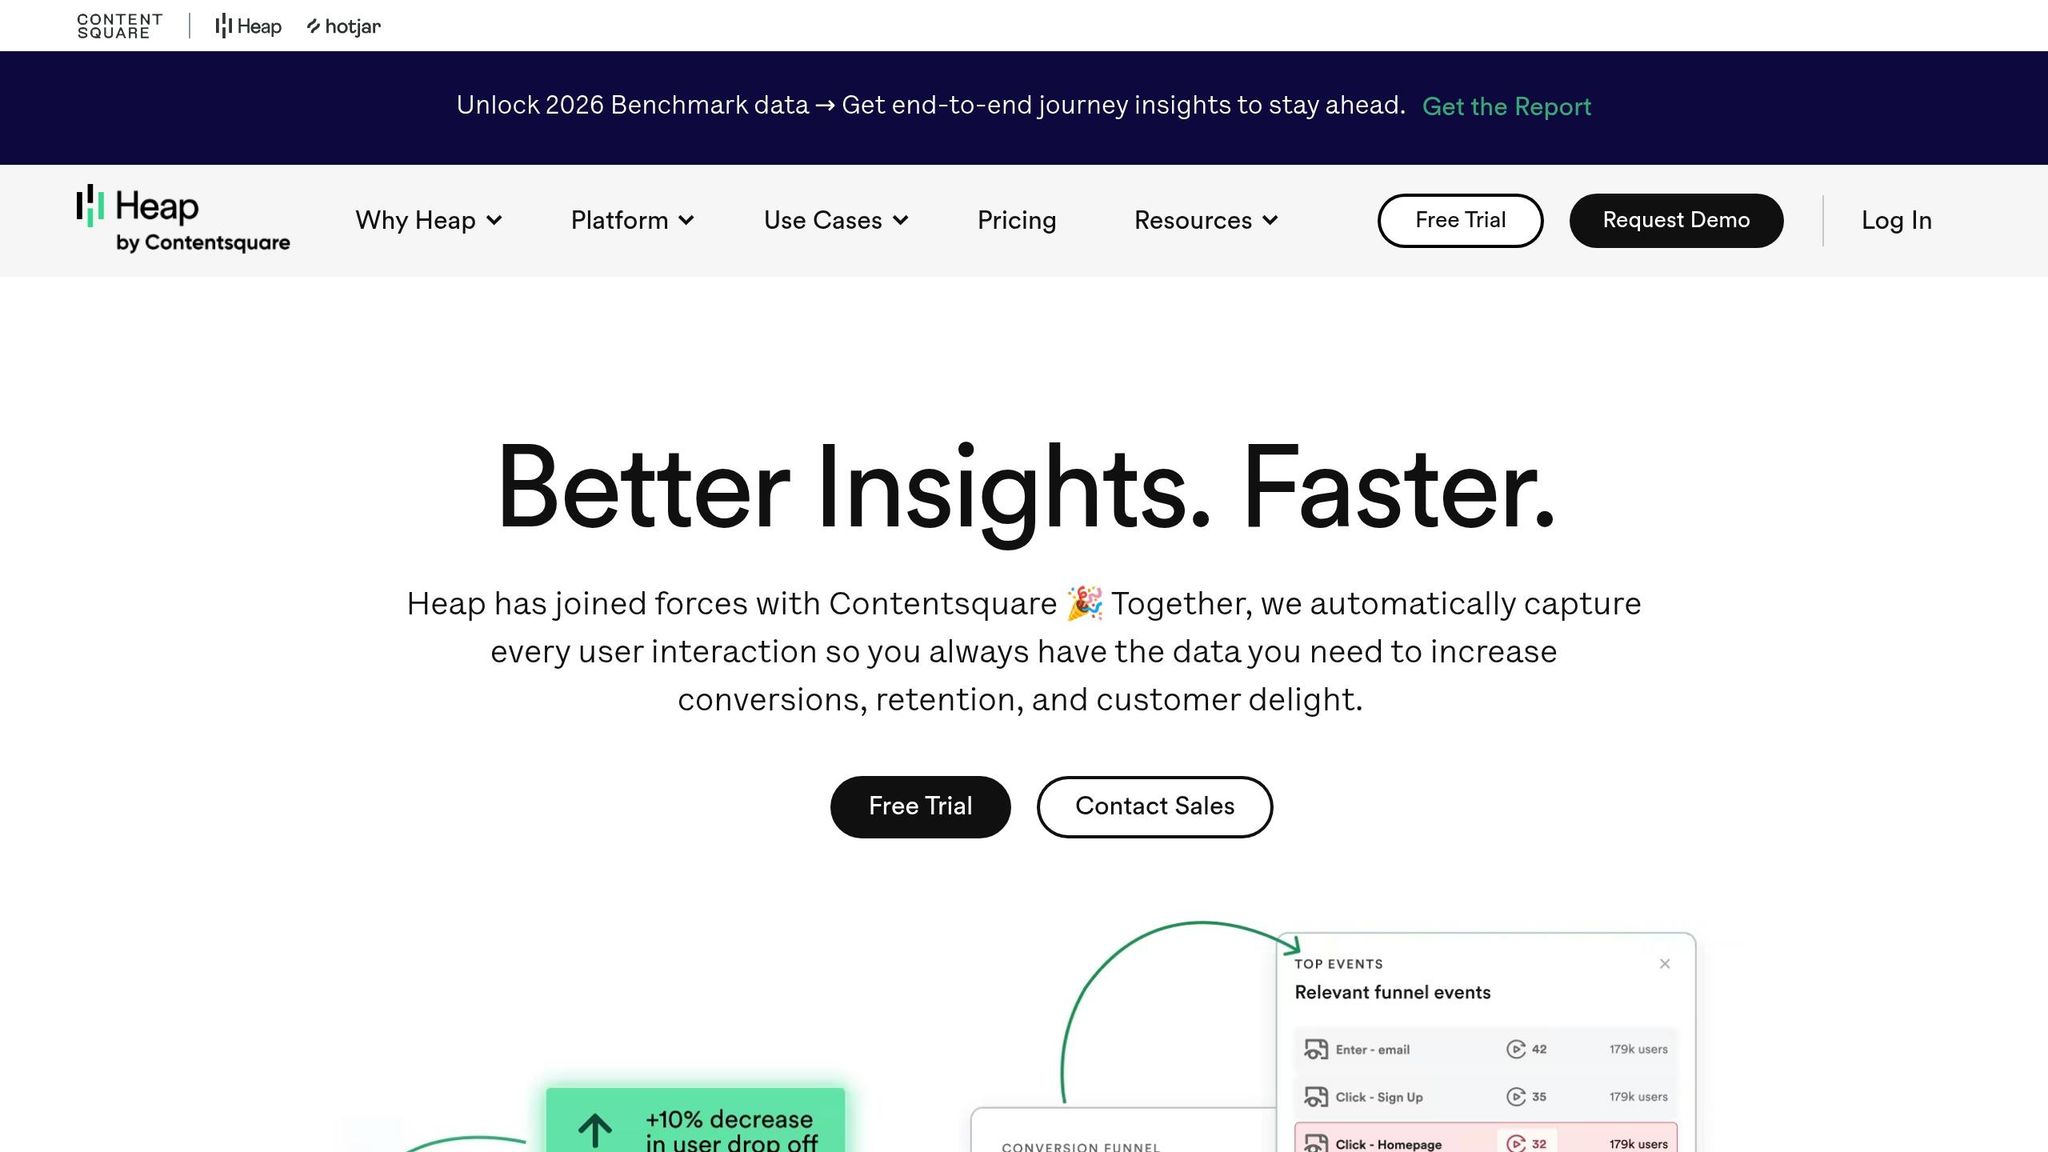
Heap’s pitch is simple: install one snippet, collect user behavior by default, and name events later. That setup works well for teams that need answers now and don’t yet have a clean event plan in place. It can track clicks, scrolls, sessions, page paths, form submissions, and repeat actions. Heap tends to work best when a team wants to spot behavior patterns before its event naming system is fully set.
Tracking Depth and Data Sources
Heap covers the main inputs most teams use for behavior analysis, often found in top analytics tools: user interactions, funnels, journeys, retention, conversion, and form activity. Since it collects data automatically, teams can go back and study events they didn’t think to define at launch. That’s a big deal when a launch goes live fast and the tracking plan lags behind.
It also includes visual event labeling, which makes life easier for non-technical users who need to define key actions after the fact. On the data side, Heap connects with Salesforce, Marketo, Optimizely, and Shopify. It also exports to warehouses like BigQuery, Snowflake, Redshift, and Databricks [13][14].
Reporting Views and Model Support
Heap supports the reporting views most product and growth teams expect: funnels, retention charts, user journey maps, behavioral cohorts, and session replays. Illuminate AI points to friction points, while Lift AI ranks those issues by estimated revenue impact [12][13]. In plain terms, Heap helps teams get from raw behavior data to a short list of fixes faster.
The tradeoff is noise. Auto-capture can pile up a lot of data, and without naming rules and governance, reports get messy fast. There’s also a maintenance issue: DOM or CSS changes can break tracked interactions. So while setup is light at the start, teams still need regular QA and cleanup if they want reporting they can trust.
Pricing
Heap has a free tier for up to 10,000 sessions per month [14]. Paid plans start at about $24,000 per year, with enterprise pricing tied to data volume [14].
Best fit: Teams that want broad behavior coverage right away without waiting on engineering to instrument every event. It also fits teams that are fine with cleaning up and governing event data after rollout. Heap stands out when you need to look back at behavior across funnels, journeys, and repeat actions.
Hotjar takes a different path, leaning more into visual analysis to show where users click and where they drop off.
4. Hotjar
Hotjar is best used as a visual behavior and feedback layer, not as your main analytics tools and resources system. It helps teams explain why users get stuck instead of just showing that a drop-off happened.
Tracking Depth and Data Sources
Hotjar tracks clicks, taps, scroll depth, mouse movement, rage clicks, and backtracks so teams can spot repeat friction across sessions [16][17]. It can also build heatmaps from past traffic without advance tagging [17]. That’s handy when you need answers fast and don’t want to rework your setup first.
Sense AI summarizes session recordings and flags friction points, which can cut down replay review time [18]. Hotjar also uses a JavaScript snippet and an Identify API to pass user attributes like plan type or account tier [18]. In practice, that gives teams a simple path from watching behavior to asking users directly what went wrong.
Reporting Views and Model Support
Hotjar works well when the goal is a tight feedback loop: find drop-off, watch recordings, and survey users on the same page [21]. Observe shows behavior, Ask collects reasons, and Engage tests those ideas through interviews [15][16].
It does not offer predictive modeling or warehouse-native event streaming, so it fits best as a qualitative layer next to a quantitative analytics tool [17]. If your team needs event-level analysis, predictive models, or a warehouse-first setup, Hotjar will feel limited.
Teams that want deeper replay and more detailed session analysis often move next to FullStory.
Pricing
Observe starts free with 35 daily sessions. Paid plans start at about $99/month. Ask starts at about $79/month, and Scale starts at $213/month with SSO and automation [18]. Paid plans cap data retention at 365 days [17].
Best fit: Marketing and CRO teams that need visual proof of user behavior plus direct feedback. It’s a strong option for diagnosing drop-off and friction, but less suited to event-level analysis, predictive modeling, and warehouse-first workflows.
For teams that need deeper replay analysis and more granular event data, FullStory goes further.
5. FullStory
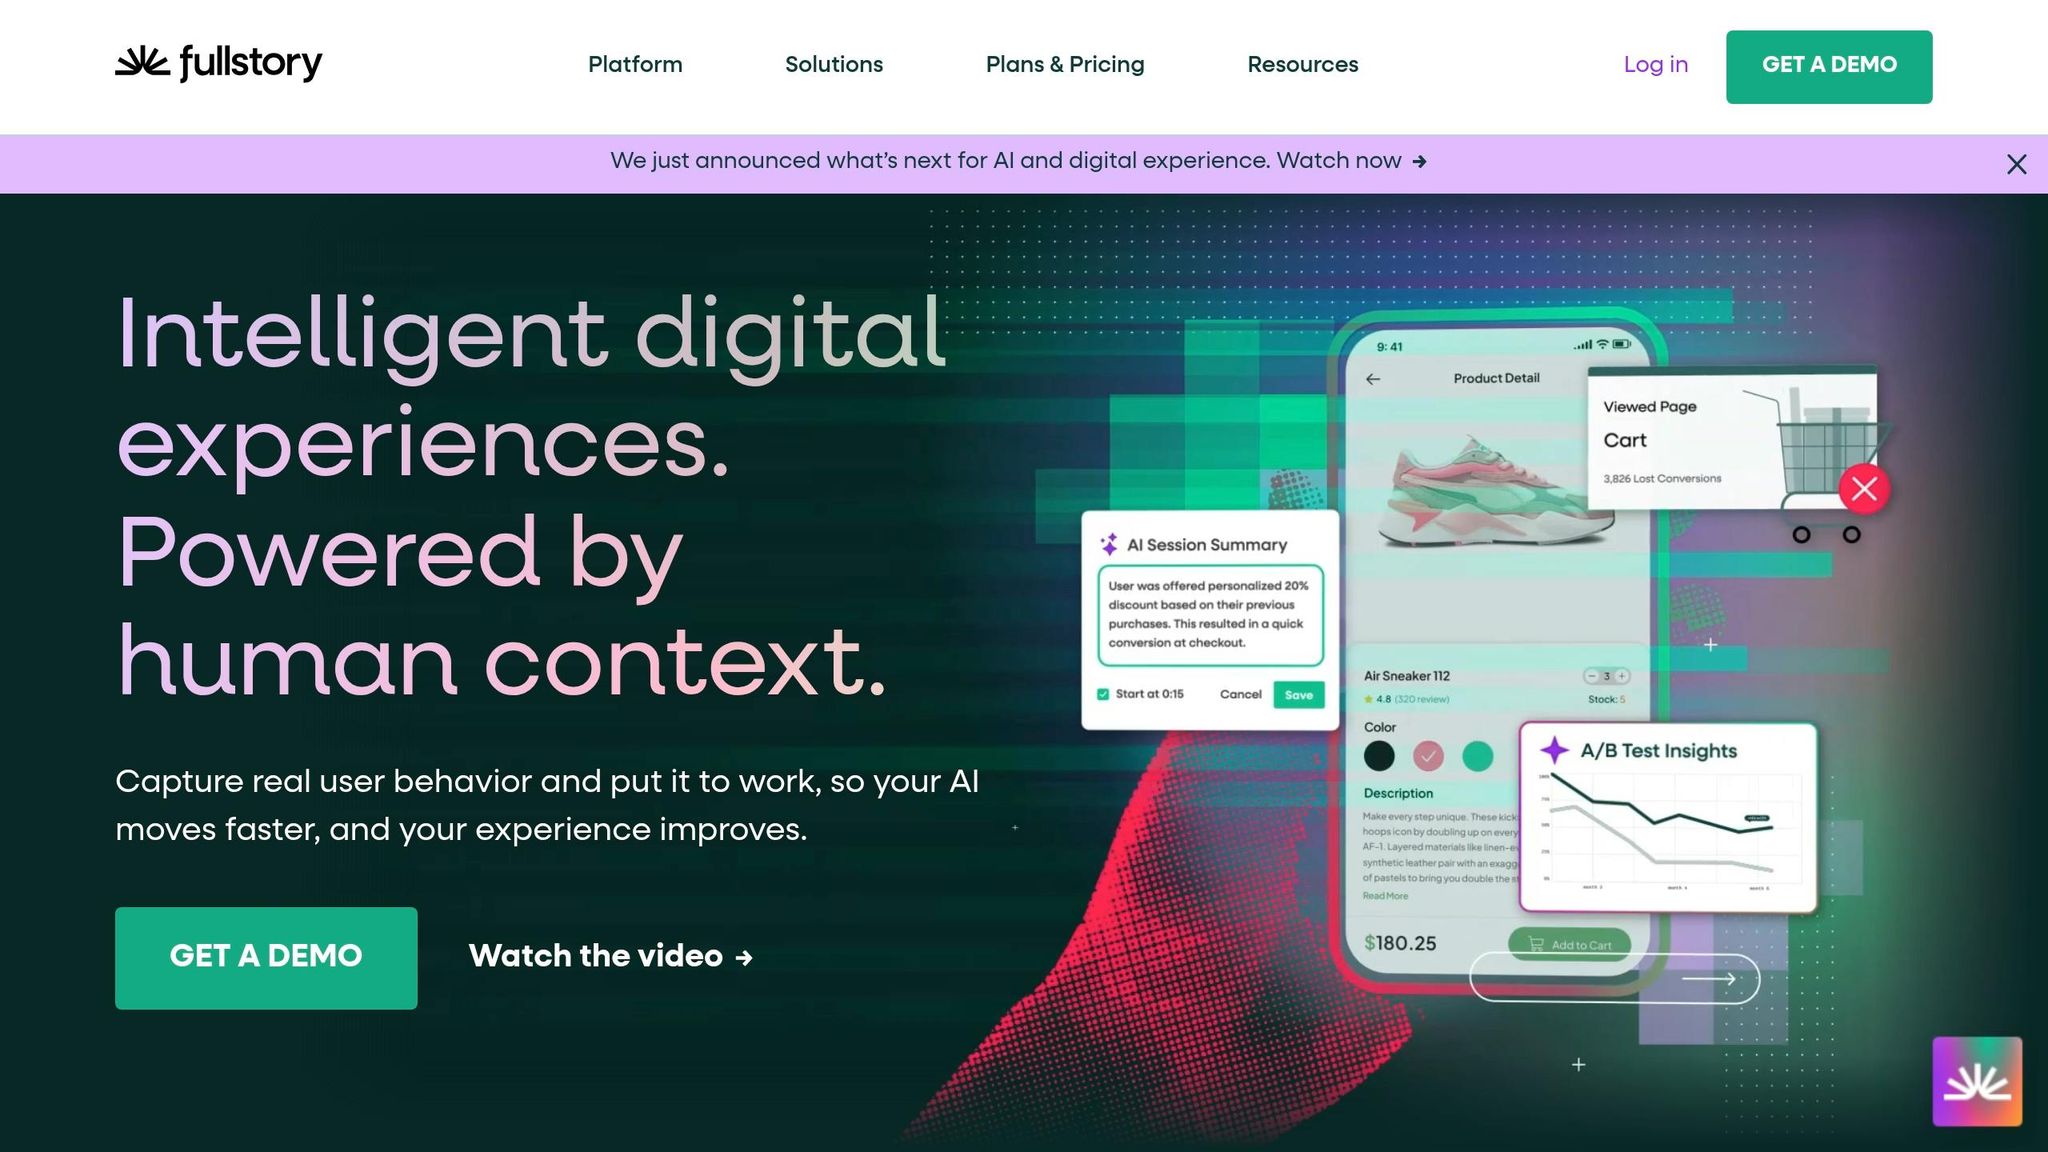
FullStory is stronger than Hotjar for session search and debugging. It pairs product analytics with session replay, so teams can find friction and tie it back to exact user actions instead of just tallying events.
Tracking Depth and Data Sources
FullStory uses automatic capture rather than manual tagging to record clicks, scrolls, form interactions, mouse movement, and mobile taps [23]. It also marks rage clicks, dead clicks, error clicks, and rapid cursor movement. On top of that, it can sync DevTools logs and network errors with session replays. That makes it easier to tell whether a problem comes from UX friction or from code. Native SDKs support iOS, Android, React Native, and Flutter [23].
Reporting Views and Model Support
OmniSearch lets teams find sessions by action, error, browser, custom attribute, or frustration signal [20][19]. Reporting includes full session replays, heatmaps, funnels, journey maps, and path analysis [20][22]. FullStory also has a Frustration Score that rolls rage clicks, dead clicks, and page abandonment into one metric [19]. Predictive Click Maps estimate likely next clicks based on past behavior. In plain terms, that helps teams see what users are likely to do next, not only what they already did [16][19].
Pricing
FullStory has a free plan with 1,000 sessions per month and 1 month of retention [23]. Business starts at $199/month for up to 10,000 sessions [19]. Higher tiers are custom-priced, and costs can climb fast as session volume grows.
Best fit: Mid-market and enterprise marketing and product teams that want replay, search, and debugging in one tool.
If the next priority is in-app guidance and adoption, Pendo is the closer fit.
6. Pendo
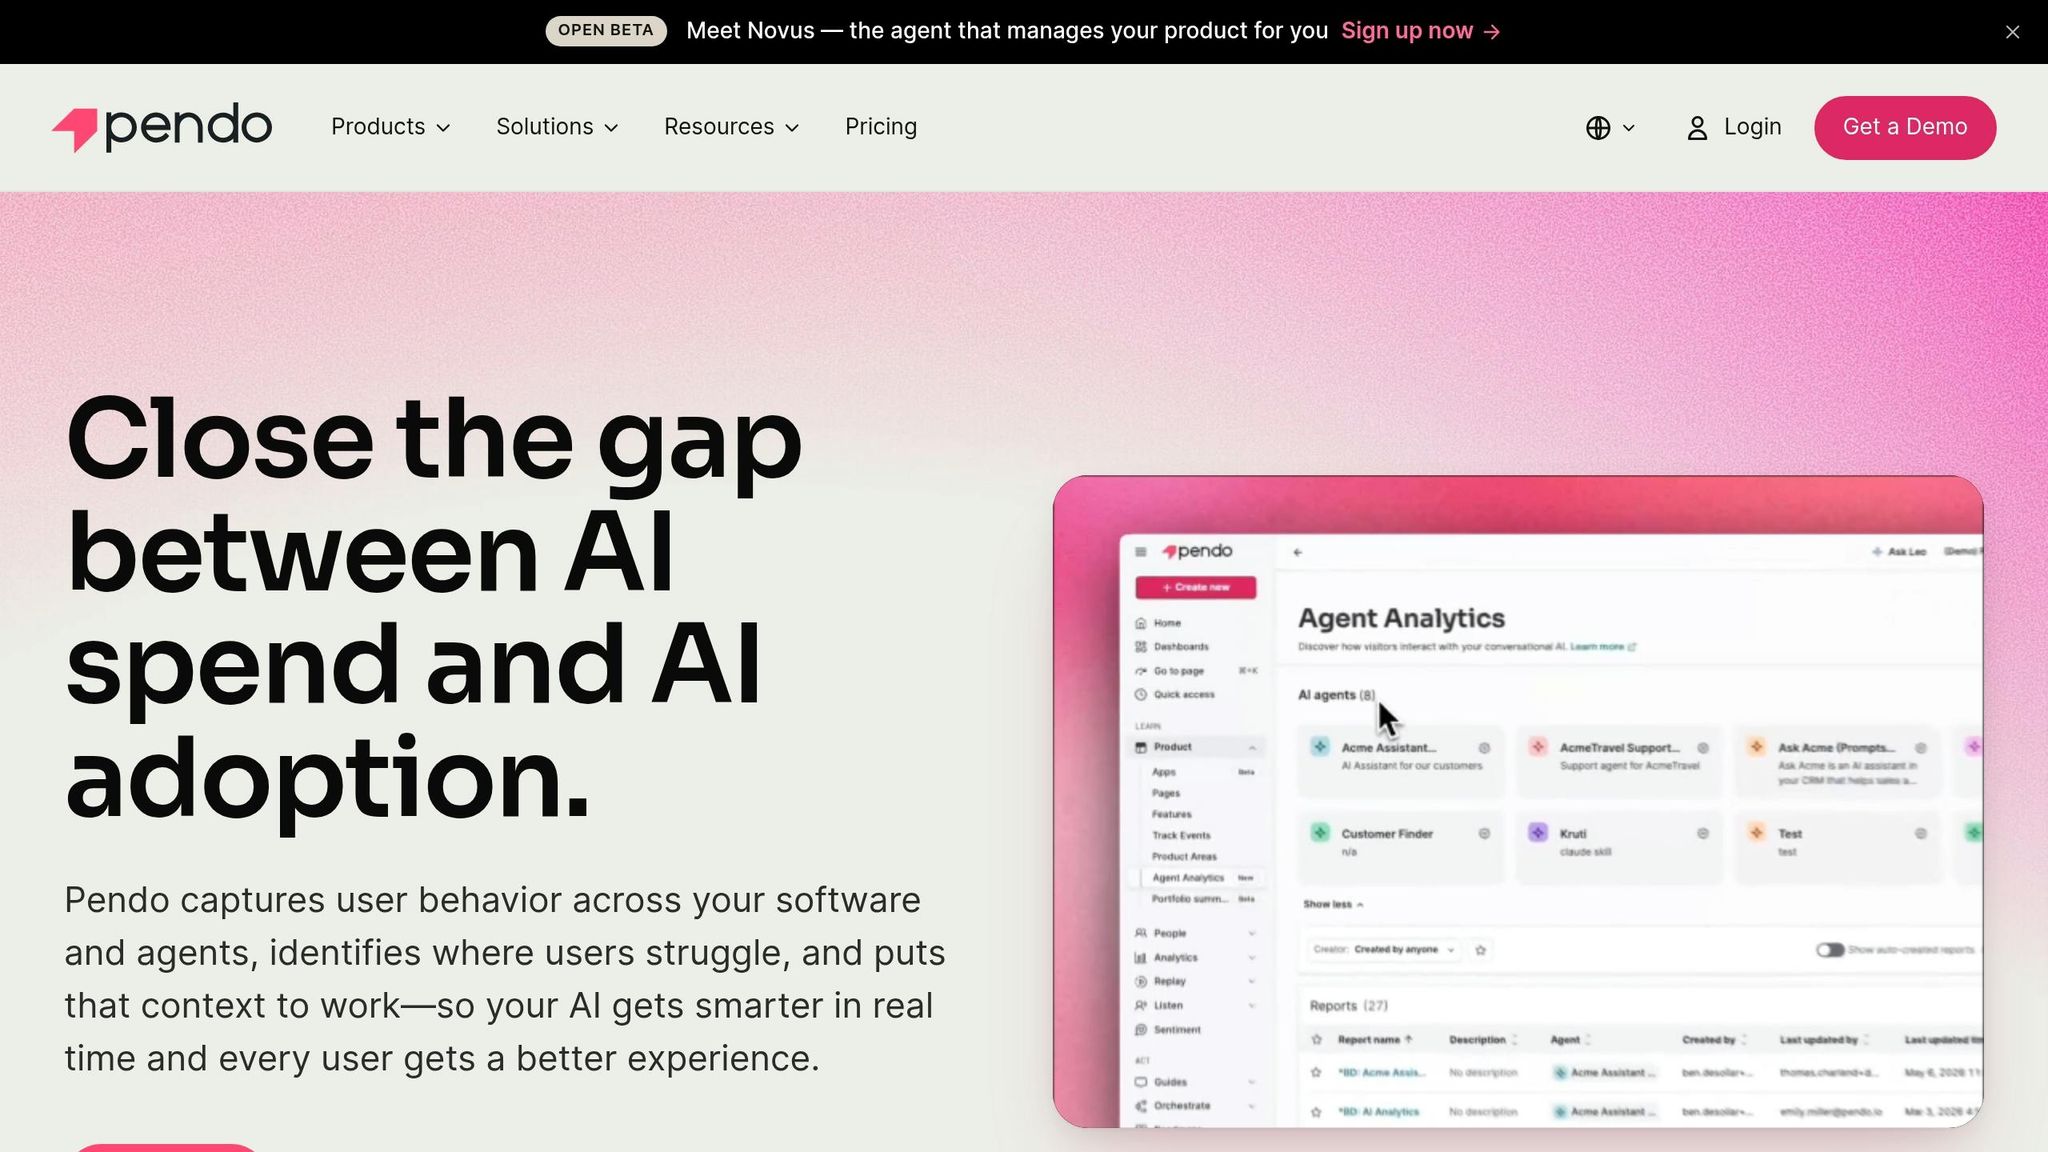
Pendo is strongest when a team needs to go from insight to in-product action in the same system. Where FullStory stops at insight, Pendo adds product analytics, in-app guidance, onboarding, and NPS, so teams can turn behavior patterns into action in one place [4][9].
Tracking Depth and Data Sources
Pendo uses autocapture to record clicks, pageviews, and form submissions across web and mobile without upfront manual event tagging [4][9]. That said, teams still need to manually tag features and pages, and setup usually takes weeks, not hours [4][9]. SDKs support web, iOS, Android, Flutter, and React Native, and Pendo also connects with tools like Salesforce and Segment [25].
Reporting Views and Model Support
Pendo includes standard reports for funnels, retention, paths, and session activity [4][25][26]. It also offers Agent Mode, which lets nontechnical users ask questions about behavior in plain English [4][25][26]. That lowers the barrier for product managers and customer success teams who want answers without digging through raw data.
Pendo is less suited than Amplitude or Mixpanel for complex funnel modeling and causal analysis [9][26]. Its edge is different: it links data to action fast. Teams can build behavioral segments - say, users inactive for 30 days - and use those segments to trigger in-app guides or walkthroughs without waiting on engineering [26]. If the goal is to act on user behavior now, not just study it, that matters.
Pricing
Pendo’s free tier supports up to 500 MAUs and includes basic analytics plus branded NPS surveys [25][26]. Paid plans - Base, Core, and Ultimate - are custom-quoted and sold annually. Pricing usually starts around $7,000 to $15,000 per year, and enterprise contracts can move into six figures as usage grows [25][26]. Session replay, warehouse sync, and unbranded surveys are reserved for higher tiers [4][26]. Since pricing scales with MAUs, teams should map growth before signing.
Best fit: Mid-market and enterprise product and customer success teams that need to measure behavior and act on it inside the product without relying on engineering for every change.
If you only need lightweight, zero-cost session monitoring, Microsoft Clarity is next.
7. Microsoft Clarity
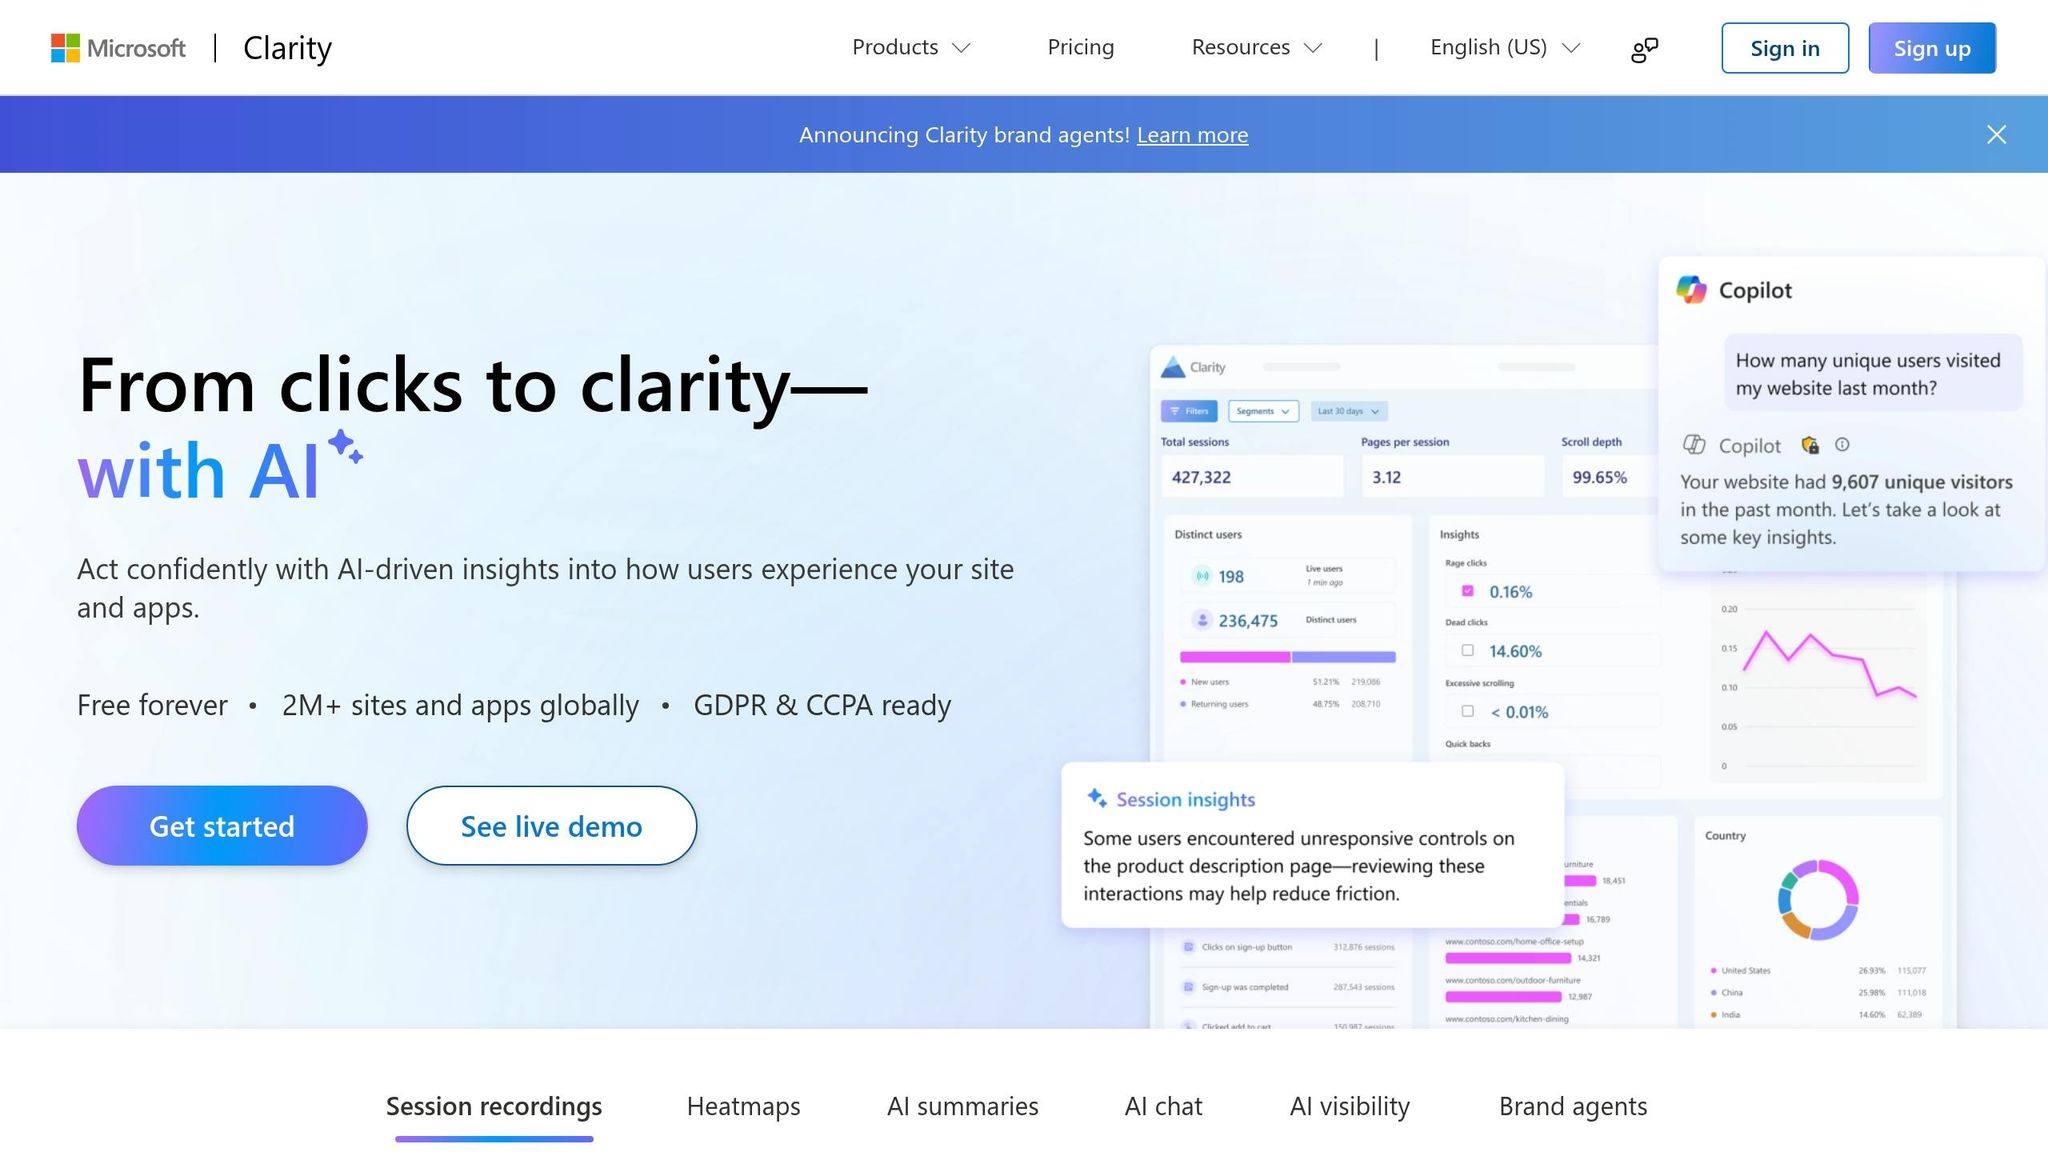
Microsoft Clarity is free forever. There are no traffic caps, no session limits, and no sampling [16][27][28]. That makes it a good fit for teams that need fast UX diagnosis, not a full product analytics stack. In practice, Clarity sits at the light end of behavior analysis: session replay, heatmaps, and friction detection without the deeper event and retention work you’d get from a product analytics tool.
Tracking Depth and Data Sources
Clarity is simple to install. You can add it with a single JavaScript snippet or through Google Tag Manager, then it starts recording mouse movements, clicks, scroll behavior, and page load timing [19][28][29]. It also flags frustration signals on its own, including rage clicks, dead clicks, excessive scrolling, and back navigation, using machine learning [28][19].
There’s a clear tradeoff, though. Clarity is web-only and does not support native mobile app tracking [16][27][20]. Custom events also need manual setup, so it offers less flexibility for event-based segmentation than tools like Amplitude or Mixpanel [20][19].
Reporting Views and Model Support
The main views are straightforward: click heatmaps, scroll heatmaps, area heatmaps, session recordings, and an AI dashboard [16][28]. If your team already uses Google Analytics 4, the native GA4 integration is handy because it lets you open Clarity playbacks right from Google Analytics [27][28]. Microsoft has also added AI features such as one-click session summaries and a conversational interface that lets users ask natural-language questions about behavior [16][19].
Clarity does use machine learning to point out patterns worth checking, but it’s not built for predictive modeling, retention tables, funnel analysis, or A/B testing tools [16][20]. Put simply, it helps teams see what happened and where users got stuck, not model what they’re likely to do next.
Pricing
Clarity has no paid tiers [16][27][28]. Recorded data stays available for up to 30 days from the time of recording [28].
Best fit: Marketing and UX teams that want a permanent no-cost layer for session replay, heatmaps, and frustration-signal detection, especially if they already use GA4. Use Clarity as a free diagnostic layer; LogRocket goes deeper on code-level debugging and session context.
8. LogRocket
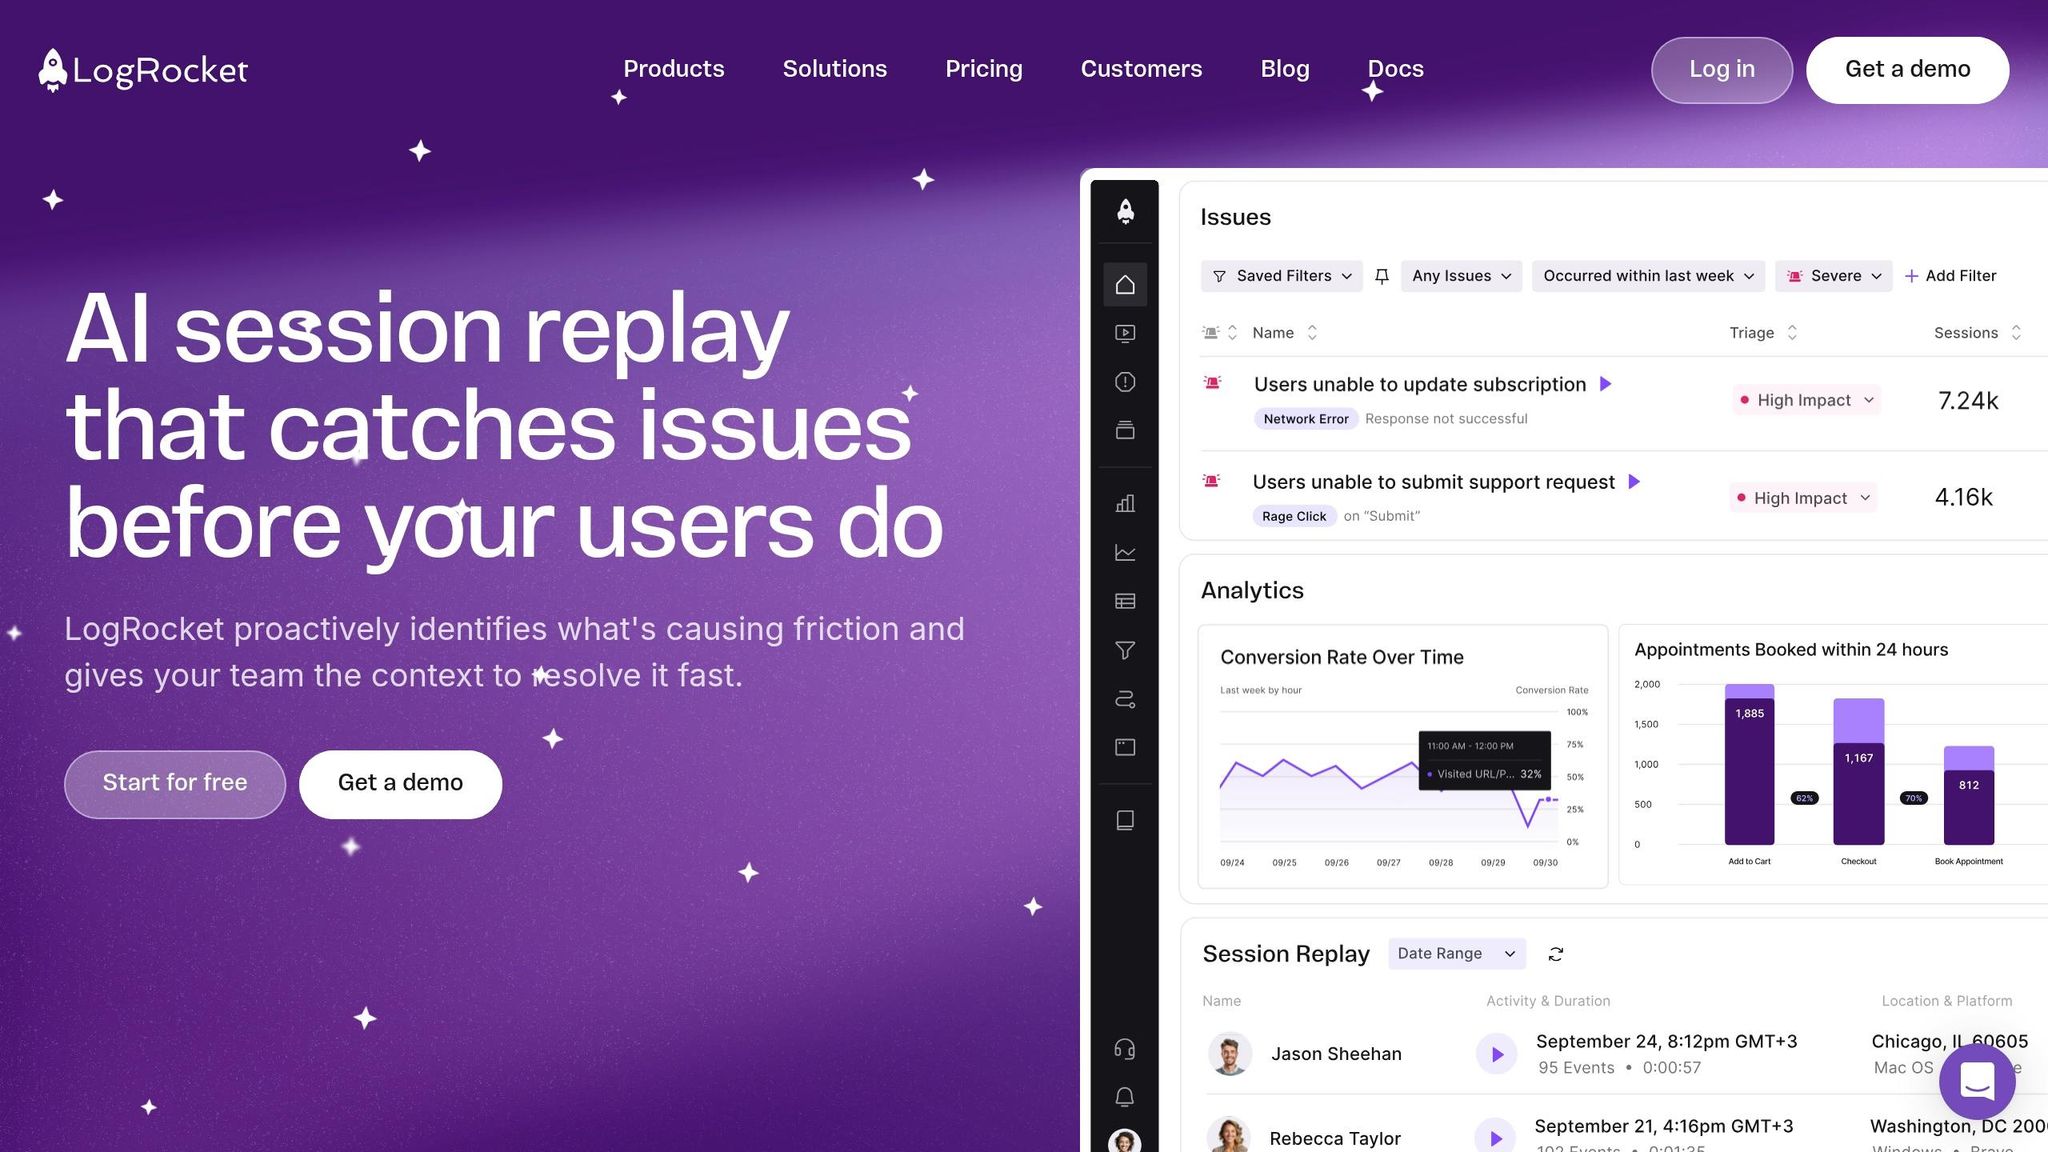
LogRocket is the better pick when the job is to tie user friction to what happened in the app. Where Clarity shows that someone struggled, LogRocket shows the replay alongside code, errors, network activity, and performance data. That makes it a strong fit for frontend-heavy product, engineering, and support teams. It also helps teams spot repeat friction patterns across many sessions, not just one-off bugs.
Tracking Depth and Data Sources
LogRocket records detailed session replays and layers in JavaScript errors, network requests, console logs, Redux/state data, and frontend performance metrics like Web Vitals, CPU usage, and slow renders [2][30]. It also flags rage clicks, dead clicks, and excessive scrolling. Support covers web, iOS, Android, React Native, Vue, and Angular [30][24].
That extra context is what makes the replay more than a video. You can watch what the user did, then check the technical trail right next to it. For debugging, that saves time.
Reporting Views and Model Support
The replay view connects straight to stack traces, error details, and alerts for error spikes or conversion drops, with Slack and Jira integrations [2][3]. Its AI struggle detection brings friction to the surface without making teams review sessions by hand.
In practice, the workflow is simple: behavior points to a problem, and the linked telemetry helps the team find the code-level cause.
Pricing
LogRocket’s free plan includes 1,000 sessions per month and 30 days of retention [2][30]. Paid Team plans start at about $31/month [30]. Higher tiers are volume-based, usually sold annually, and there’s also a self-hosted enterprise option for teams with stricter data-control needs [2].
Best fit: Frontend engineering, product, and support teams that need to connect behavior patterns to technical errors and performance data. Use it when you need behavior data tied to technical errors and performance, not just UX observation.
9. Quantum Metric
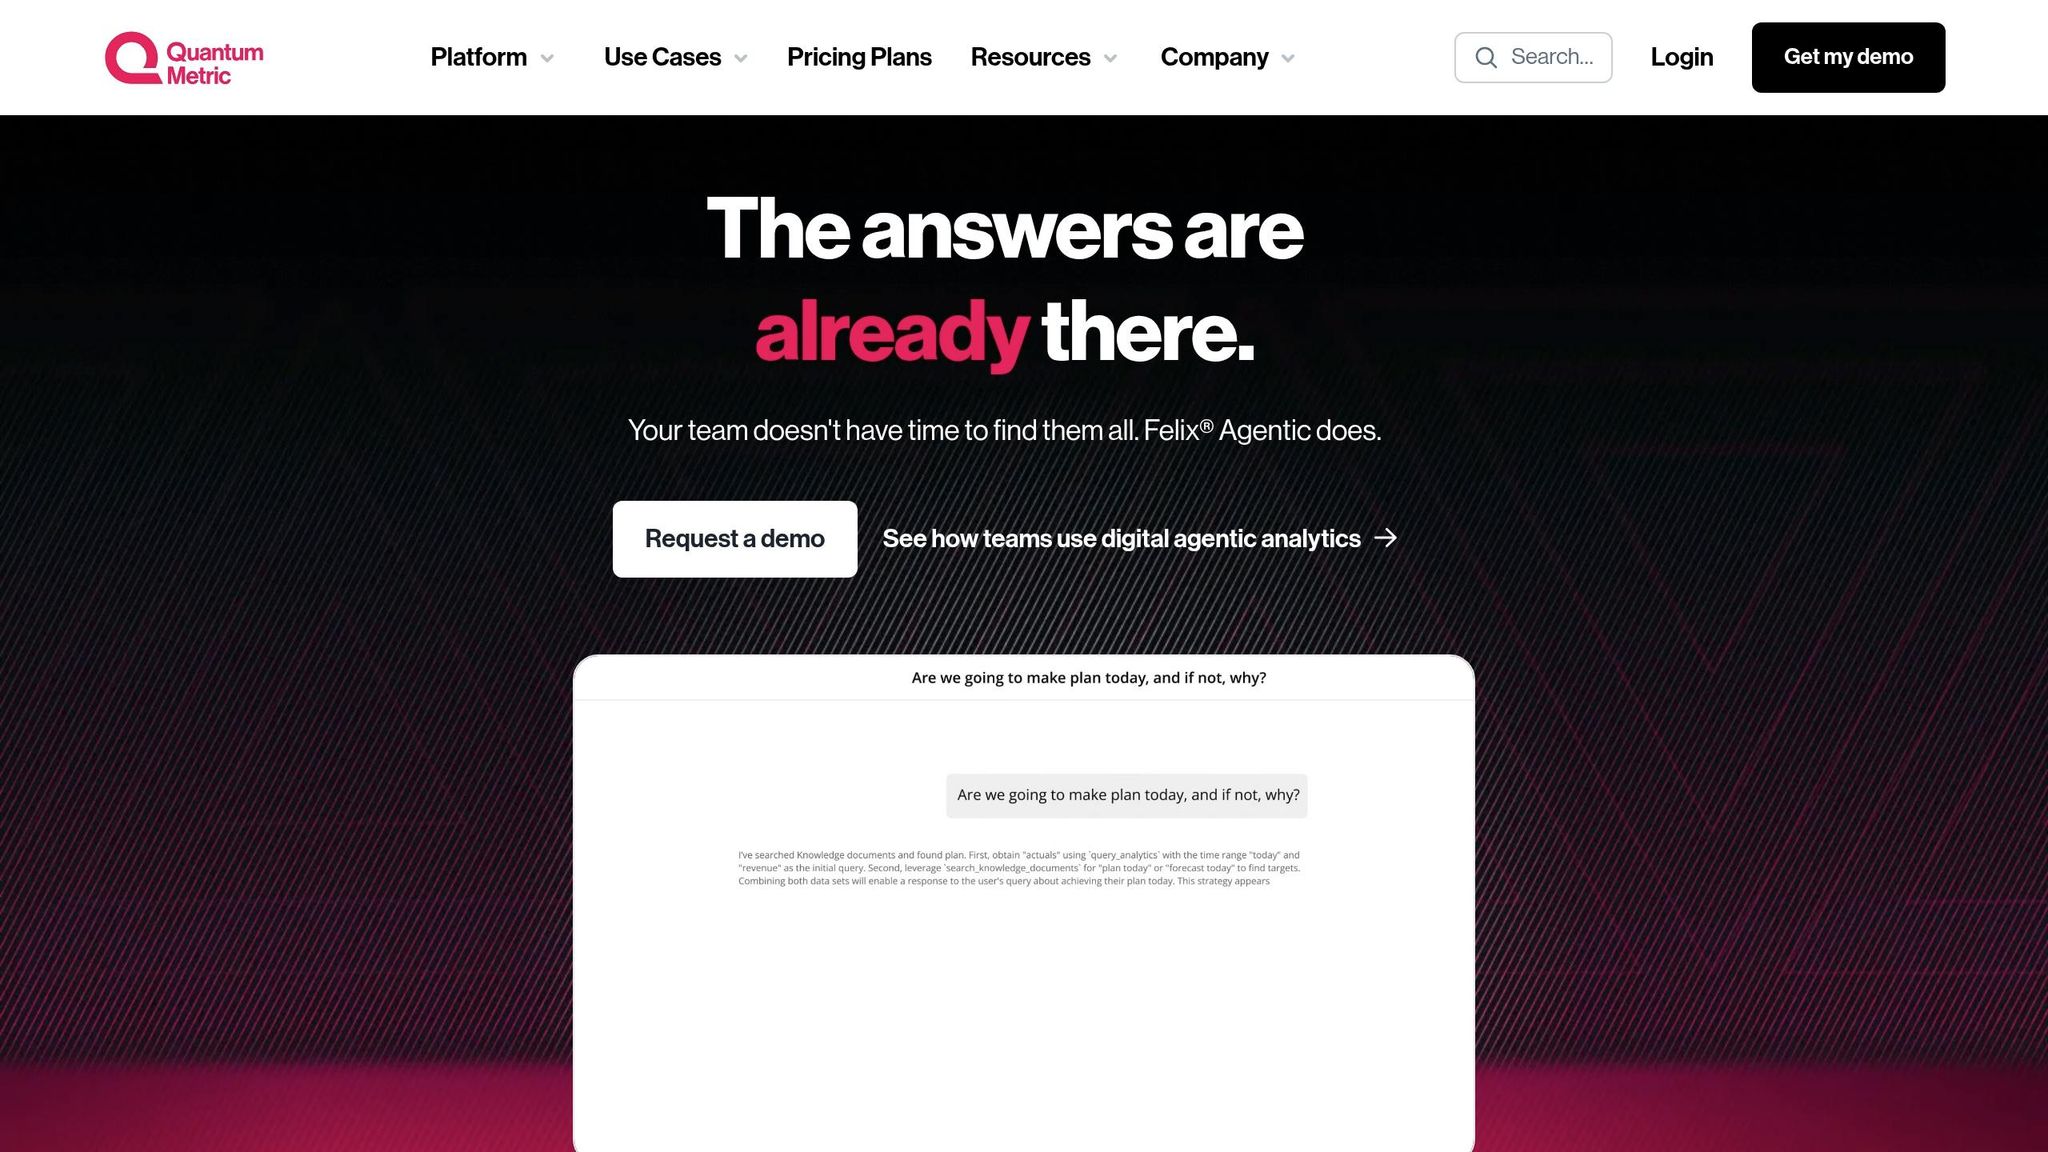
Quantum Metric is built for teams that need real-time behavior data tied to revenue, not just session replay. Unlike the replay-first tools above, it focuses on automated issue detection and always-on monitoring across large volumes of traffic. It is an enterprise behavior analytics platform that connects user behavior to revenue impact [1].
Tracking Depth and Data Sources
Quantum Metric captures sessions in real time across web and mobile, including clicks, scrolls, mouse movements, and taps [1]. It brings together quantitative event data with qualitative session replays and heatmaps, so teams can see both what happened and how it happened [1].
The big difference is scale. This is not a lighter tool meant mainly for spot-checking recordings. It is built for full-user-base monitoring, with data flowing in all the time.
Reporting Views and Model Support
Its AI anomaly detection flags friction, conversion drops, and performance problems before they hit revenue [31]. Journey analytics help teams map customer paths, find drop-off points, and improve funnels across large datasets [31]. Real-time performance monitoring gives teams a way to catch issues as they show up, not hours later [31].
That mix of scale, automation, and live monitoring is what sets Quantum Metric apart from lighter replay tools.
Pricing
Quantum Metric is priced for enterprise buyers. Specific tiers are not published publicly [24].
Best fit: Enterprise product, UX, and engineering teams that need real-time behavior data tied to revenue impact - not just session observation. It fits enterprises that need always-on monitoring across the full digital experience, rather than simple session review.
Feature, Pricing, and Fit Summary
The profiles above explain how each product works. This section sorts them by buying decision so you can narrow the list faster.
Best Tools by Primary Use Case
These 9 tools cluster into a few clear buckets:
- Mixpanel / Amplitude - event analytics
- Heap / Pendo - autocapture and product activation
- Hotjar / Microsoft Clarity - visual diagnostics
- FullStory / LogRocket - replay plus debugging
- Quantum Metric - enterprise-scale monitoring
From there, the big question is simple: how much setup, control, and data modeling power do you want?
How They Differ on Tracking, Reporting, and AI
The clearest split is autocapture vs. manual tagging. That’s the tradeoff between faster setup and tighter schema control.
Reporting also changes a lot by product type. Visual tools lean on heatmaps and session replay to show friction. Event-led tools focus on funnel drop-off, retention cohorts, and path analysis. On the AI side, FullStory and Microsoft Clarity summarize sessions and flag frustration signals on their own, while Amplitude and Pendo include experimentation and feature flagging for teams that want to test product changes against behavior data [2][16][33].
Those tradeoffs show up pretty fast in pricing and team fit, which the tables below lay out.
Pricing Patterns in the U.S. Market
In the U.S., pricing usually follows 1 of 4 models: event-based, session-based, MTUs, or custom enterprise contracts.
| Tool | Free Tier | Paid Entry Point |
|---|---|---|
| Microsoft Clarity | Unlimited free access, no traffic limits [16] | Free forever [16] |
| Mixpanel | Free forever, up to 1M events/month [33] | Growth starts at $0.28 per 1,000 events [33] |
| Amplitude | Free Starter, 10,000 MTUs/month [33] | Plus starts at $49/month, billed annually [33] |
| Hotjar | Free plan, 35 daily sessions [16] | Paid plans start at $99/month [18] |
| FullStory | Free plan, 1,000 sessions/month [23] | Business starts at $199/month [19] |
| Heap | Free plan, 10,000 monthly sessions [2] | Paid plans start at ~$24,000/year [14] |
| LogRocket | Free plan, 1,000 sessions/month [2] | Team plans start at ~$31/month [30] |
| Pendo | Free up to 500 MAU [3] | Paid plans are custom-quoted [3] |
| Quantum Metric | None [1] | Enterprise-level custom pricing [1] |
Microsoft Clarity stands out as the only product here with unlimited free access [16]. Mixpanel also gives a lot of room on its free tier if your main job is event tracking. By contrast, FullStory, Heap, Pendo, and Quantum Metric all push you into a sales process before you can get the full commercial picture [1][2].
Matching Tools to Common Team Needs
If you want a fast short list, start here.
| Team Need | Best Tool | Why |
|---|---|---|
| Zero-budget startup | Microsoft Clarity | Completely free with no traffic limits [16] |
| SaaS funnel analysis | Amplitude | Behavioral cohorts plus experimentation [2][33] |
| Qualitative UX research | Hotjar | Heatmaps, session replay, and feedback tools [2][16] |
| Engineering troubleshooting | LogRocket | Session replay tied to JS errors and network logs [2] |
| Enterprise journey analytics | Quantum Metric | Ties digital behavior to business impact [1] |
| Teams without engineering bandwidth | Heap | Autocapture removes the tagging bottleneck [2] |
Pros and Cons
The tool-by-tool comparison above shows what each platform does. This section narrows that into the buying tradeoffs that tend to matter most.
Strengths That Matter in Real Evaluations
The main divide is manual tracking vs. autocapture. For marketing teams and analysts, that decision affects setup time, data quality, and governance over time.
Mixpanel and Amplitude lean toward manual control. That usually means cleaner analysis and tighter event taxonomy, but it also asks more from engineering. Heap and FullStory lean on autocapture, which lets teams define events later instead of tagging everything up front. That can save time early on, especially for lean teams.
FullStory also adds detailed session replay. LogRocket pairs replay with errors and network logs. Microsoft Clarity stands out for a different reason: it is completely free, has no traffic limits, and automatically surfaces frustration signals like rage clicks and dead clicks [2][32]. The catch is that Clarity is a weaker fit for privacy-sensitive teams. In other words, each strength comes with a cost in setup, scale, or governance.
Tradeoffs to Check Before Buying
Manual tools need developer time on an ongoing basis. If your event plan changes often, that work adds up.
Autocapture tools cut down setup work, but they can also create noisy data that needs cleanup before teams can trust it [2]. That tradeoff sounds small at first, but it matters once more people start using the data.
Pricing pressure is another issue. FullStory and LogRocket can get expensive as session volume grows [2]. Pendo and Quantum Metric use sales-led pricing, which can slow down evaluation and make side-by-side budgeting harder [1][3]. Clarity removes the budget issue because it is free, but its data policy makes it less suited to privacy-sensitive teams.
Pros and Cons Table
Use this table to match each tool to the team and workflow it fits best.
| Tool | Pros | Cons | Ideal Team |
|---|---|---|---|
| Mixpanel | Strong taxonomy control; clean event structure over time [2] | Requires manual instrumentation and ongoing maintenance | Product/growth with engineers |
| Amplitude | Behavioral modeling and predictive cohorts [2] | Requires manual instrumentation; enterprise pricing is non-transparent [2] | Data-heavy product teams |
| Heap | Autocapture removes tagging bottlenecks; retroactive event definition [2] | Data can become noisy and require cleanup [2] | Non-technical PMs |
| Hotjar | Easy visual setup; heatmaps and recordings; low maintenance [2] | Not built for complex event structure or deep quantitative analysis | UX/CRO teams |
| FullStory | Detailed session replay; automatic capture with searchable data [2] | Costs scale quickly with session volume [2] | Digital experience teams |
| Pendo | In-app guidance plus analytics in one platform; automatic capture plus manual tagging [3] | Sales-led pricing | Product/onboarding teams |
| Microsoft Clarity | Completely free with no traffic limits; rage click detection [2][32] | No custom event tracking; free, but less suitable for privacy-sensitive teams [34] | SMBs and zero-budget teams |
| LogRocket | Session replay tied to JavaScript errors and network logs [2] | Costs scale quickly with volume [2] | Engineering/QA |
| Quantum Metric | Enterprise-scale automatic capture; connects behavior to business impact [1] | No free tier; high entry cost; requires a sales process [1] | Enterprise digital teams |
Conclusion
The right tool comes down to what you need to measure, how much engineering support you have, and what you can spend.
If you look at tracking depth, reporting style, and price, the top picks split pretty cleanly by use case. Mixpanel and Amplitude work best for deep product analytics. Heap makes sense for teams that want autocapture. FullStory is the stronger choice for session replay, while Hotjar is better for fast visual checks and user feedback. LogRocket is the specialist option when developers need to tie replays to JavaScript errors and network requests [2]. Quantum Metric and Pendo fit enterprise teams that need behavior data linked to action. If low-cost entry is the main goal, Microsoft Clarity stands out: unlimited heatmaps and session recordings, no traffic limits, and free forever [16][19].
For most teams, the best setup is one tool for event patterns and one for session context. If you're trying to find where users drop off, pair an event analytics tool with a replay tool. Then pick the setup that fits your data depth, team bandwidth, and budget.
FAQs
Which tool should I start with first?
Start with the goal. Pick the tool based on what you need most: conversion optimization, technical debugging, or deep product analytics.
If you want both numbers and on-page behavior, Hotjar and FullStory are solid picks. If your main filter is cost and privacy, Microsoft Clarity is a good place to start. If retroactive event analysis is the key requirement, look at Heap. You can also use the Marketing Analytics Tools Directory to narrow the field by use case, team size, and technical needs.
Do I need both event analytics and session replay?
Yes. Event analytics tells you what is happening at scale - things like funnel drop-offs and retention trends. Session replay shows you why it's happening by letting you watch actual user interactions, errors, and points where people get stuck.
Used together, they link high-level behavior patterns to individual user experiences.
How do I choose between manual tracking and autocapture?
It comes down to speed vs. control.
Autocapture tools like Heap and FullStory log user interactions on their own. That makes setup faster, and it lets teams look back at past behavior without having to define every event upfront.
Manual tracking fits better when you need tight control over what gets measured or want to cut down on noisy data. Pick the approach that matches your team: broad insight right away, or more exact, custom event data.