Measuring influencer campaign ROI is critical for understanding whether your investment drives real business results. Many marketers struggle with this, but by following a clear process, you can calculate ROI accurately and optimize future campaigns.
Key takeaways:
- ROI Formula: Use
(Total Revenue - Total Costs) ÷ Total Costs × 100to calculate profit percentage. Include all costs like influencer fees, product seeding, shipping, and logistics. - Tracking Methods: Combine UTM links, promo codes, tracking pixels, and server-side tracking with top marketing analytics tools for better attribution.
- Metrics Beyond ROI: Track Cost per Acquisition (CPA), Return on Ad Spend (ROAS), and Customer Lifetime Value (CLV) for a deeper understanding of campaign performance.
- Attribution Models: Use multi-touch attribution instead of last-click to credit influencers throughout the customer journey.
- Long-Term Impact: Consider brand awareness, sentiment, and indirect value, which can account for 40%-60% of a campaign's impact.
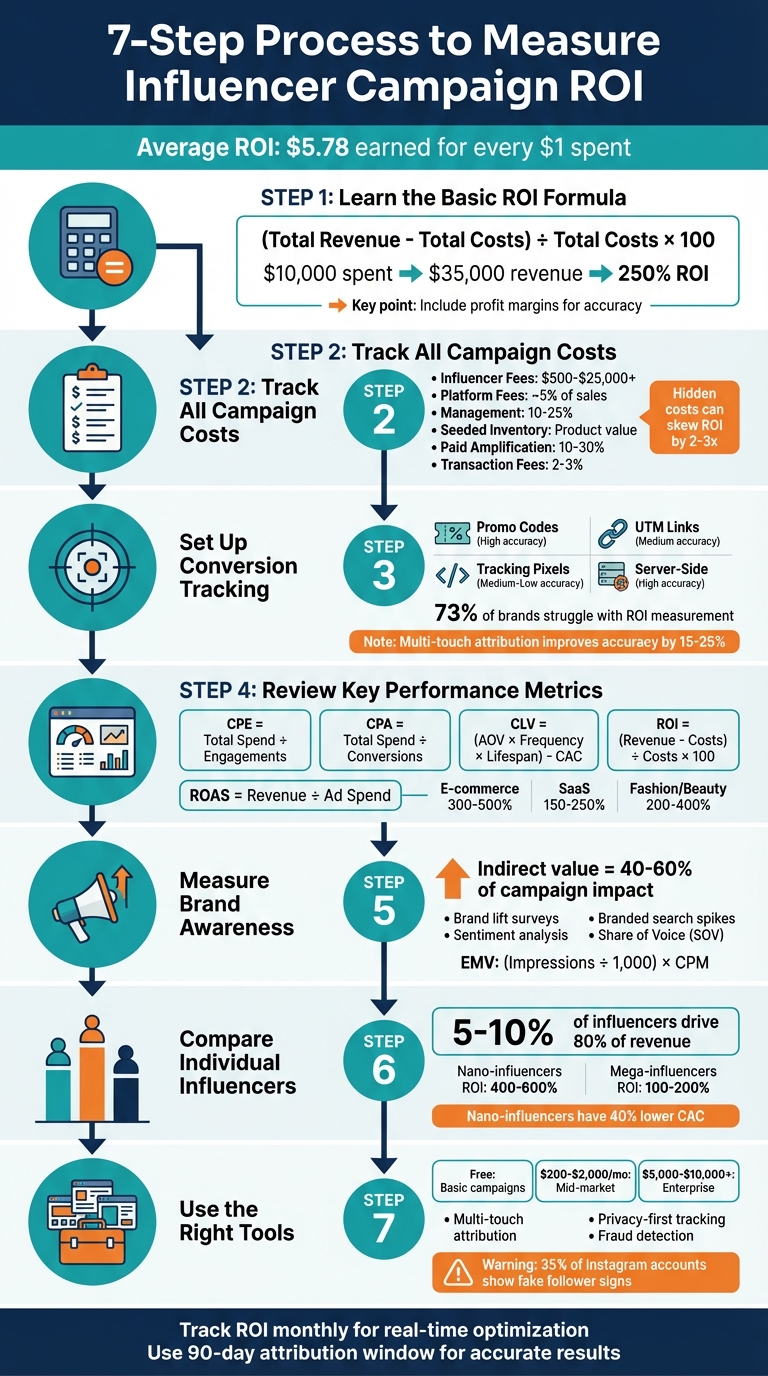
7-Step Process to Measure Influencer Campaign ROI
How to Measure Influencer Marketing ROI (5-Step Guide + Formula Explained)
sbb-itb-5174ba0
Step 1: Learn the Basic ROI Formula
To measure the success of an influencer campaign, start with a simple formula: (Total Revenue – Total Campaign Costs) ÷ Total Campaign Costs × 100. This formula calculates the percentage of profit earned compared to your total investment.
Here's an example: if you spend $10,000 on a campaign and generate $35,000 in revenue, the calculation is: ($35,000 - $10,000) ÷ $10,000 × 100 = 250% ROI. A positive ROI indicates profit, while a negative ROI signals a loss. The higher the percentage, the better the campaign performed.
For a more accurate picture, use profit margins instead of gross revenue. For instance, if a $300 sale has a 40% profit margin, calculate ROI using the $120 profit instead of the full sale amount. The adjusted formula becomes: (Revenue × Profit Margin – Marketing Cost) ÷ Marketing Cost × 100. This method avoids overestimating ROI by 2–3x and provides a better understanding of your actual profit. To further refine your calculations, make sure to include all related costs.
Include Product Costs in Your Calculation
To ensure accuracy, account for every expense in your campaign - not just influencer fees. Many brands overlook key costs like product seeding, inventory, shipping, and logistics, which can lead to inflated ROI calculations.
For example, if you send $5,000 worth of products to influencers for reviews or giveaways, that amount needs to be included in your Total Campaign Costs. So, if you paid $15,000 in influencer fees and provided $5,000 in products, your actual campaign cost is $20,000 - not $15,000. This changes your ROI significantly: ($52,000 - $20,000) ÷ $20,000 × 100 = 160% ROI, compared to the inflated 247%.
"Your true influencer marketing ROI calculation methodology must include all these costs. Many brands calculate false ROI by ignoring hidden costs." - InfluenceFlow
Don’t forget to include shipping and logistics expenses. The cost of packaging and delivering products to influencers adds up quickly and directly impacts your ROI. By tracking these details, you’ll ensure a more realistic and reliable calculation using top analytics tools for business. Every dollar spent matters, so make sure it’s all accounted for.
Step 2: Track All Campaign Costs
Getting an accurate ROI for your influencer campaign means tracking every single expense - not just the creator's fee. Leaving out hidden costs can skew your ROI by as much as 2–3x. To avoid this, you need a system that captures everything, from fees to logistics, in real time. Whether it’s a spreadsheet, CRM, or dashboard, a centralized tracking method is essential.
For global campaigns, stick to a single currency and use fixed exchange rates. Set a "period close" date - usually 90 days after the campaign wraps up - to finalize cost and revenue tracking. This extra time lets you account for late conversions and ensures a clear financial picture. Once your currency and close date are locked, don’t forget to include all labor-related costs.
"Many marketers overvalue vanity metrics like followers or likes and underestimate true costs such as product gifting or management time." – Streak
Main Cost Categories to Monitor
Here are the key expense categories to keep an eye on so you’re not caught off guard:
- Influencer Fees: These can range widely - from $500 for nano-influencers to $25,000 or more for macro-influencers. Payment structures vary, including flat fees, commission-based models (often 10–30%), or hybrids that mix a base fee with performance bonuses.
- Platform and Software Fees: Instagram and TikTok charge approximately 5% on sales for features like Instagram Checkout and TikTok Shop. Affiliate networks may take a 15–30% commission, while payment processors typically charge 2–3% per transaction. Don’t forget to include subscription costs for influencer marketing tools.
- Management and Labor Costs: Factor in agency fees (usually 10–25% of your total spend), internal salaries, and team coordination time. For example, if your team spends 10 hours on the campaign at $50/hour, that’s an additional $500. Include time for creative work, compliance, and other administrative tasks.
- Seeded Inventory and Logistics: Account for the cost of goods sold (COGS) for any products you gift to creators, plus shipping, handling, and packaging expenses.
- Paid Media Spend: Boosting influencer posts with paid media - through methods like whitelisting or Spark Ads - can take up 10–30% of your total campaign budget.
| Cost Category | Typical Impact/Rate | What to Include |
|---|---|---|
| Influencer Fees | $500–$25,000+ | Flat fees, commissions, performance bonuses |
| Platform Fees | ~5% of sales | Instagram Checkout, TikTok Shop fees |
| Management | 10–25% | Agency fees, internal labor, legal reviews |
| Seeded Inventory | Product value | COGS, shipping, packaging, taxes |
| Paid Amplification | 10–30% | Budget for whitelisting, Spark Ads |
| Transaction Fees | 2–3% | Payment processing charges |
Step 3: Set Up Conversion Tracking and Attribution
After finalizing your costs, the next step is figuring out which influencers are driving sales. Without proper tracking, you're essentially guessing - 73% of brands report that measuring ROI from influencer campaigns is one of their biggest hurdles. A solid tracking strategy can bring much-needed clarity.
The best approach? Combine multiple tracking methods. Start with UTM links to track which influencer is driving traffic and how visitors interact with your site. Pair this with unique promo codes for direct sales attribution. Why both? Because only 20–30% of customers influenced by a creator actually use promo codes. This hybrid method ensures you capture both direct and indirect conversions.
Platform tracking pixels - like Meta Pixel or TikTok Pixel - are useful for tracking actions like purchases or sign-ups on your site. But with privacy changes (thanks, iOS updates) and cookie deprecation, these pixels now only capture about 40–50% of customer journeys. To fill in the gaps, server-side tracking is a game-changer. It bypasses browser restrictions by sending data directly from your server to top website analytics tools, helping you recover 20–30% of conversion data that would otherwise be lost.
For campaigns running across multiple platforms, affiliate links add another layer of insight. These links use cookies to credit influencers for sales within a set window, typically 7–30 days. To avoid messy data in Google Analytics 4, standardize your UTM parameters - use lowercase letters and hyphens instead of underscores. This consistency is key for accurate reporting.
Tracking Methods That Work
Here’s a quick comparison of effective tracking methods and their strengths:
| Method | Accuracy | Best For | Key Limitation |
|---|---|---|---|
| Promo Codes | High | Tracking cross-device and word-of-mouth sales | Customers may forget to use them |
| UTM Links | Medium | Monitoring site behavior and traffic quality | Lost if users switch devices or clear cookies |
| Tracking Pixels | Medium-Low | Retargeting and tracking on-site actions | Impacted by iOS privacy updates and blockers |
| Server-Side | High | Privacy-compliant tracking; bypassing browser restrictions | Requires technical setup and resources |
Brands that use UTM tracking report a 40% improvement in attribution accuracy compared to those relying only on platform analytics. However, consistency is a challenge - 73% of marketing teams use UTM parameters, but only 31% stick to a standardized naming format. To keep things clean, set a clear format from the start, like: utm_source=influencer_handle&utm_medium=social&utm_campaign=launch_date.
Once your tracking is in place, the next step is choosing the right attribution model.
Pick the Right Attribution Model
Attribution models help determine how to credit influencers when customers interact with multiple touchpoints before making a purchase. The old last-click attribution model - where all credit goes to the final interaction - is becoming less reliable. It ignores the contribution of influencers who build awareness and is further weakened by cookie deprecation.
A better option is multi-touch attribution (MTA), especially since customer journeys often span platforms like TikTok, Instagram, email, and more before converting. Brands that adopt advanced attribution models typically see a 15–25% boost in marketing ROI. The key is to match your model to your sales cycle. For short B2C e-commerce cycles, a time-decay model works well, giving more credit to touchpoints closer to the purchase. For longer B2B journeys, a U-shaped model (40% credit to the first and last touchpoints) makes more sense.
For campaigns with high volumes - 1,000+ monthly conversions - data-driven attribution is the gold standard. This method uses machine learning to analyze user journeys and assigns credit based on statistical likelihood. It can improve ROI accuracy by 25–35%. Adjust attribution windows to match your product type: 7–14 days for impulse buys and 60–90 days for higher-priced items.
Finally, don’t forget to run incrementality tests. These tests use holdout groups (audiences not exposed to influencers) to measure the actual "lift" your campaign generates. On average, about 35–40% of attributed conversions in digital campaigns are genuinely incremental - meaning the campaign directly caused the sale.
Step 4: Review Key Performance Metrics
ROI might grab the spotlight, but it doesn't give you the full picture. To truly understand your campaign's impact, you need to dive deeper into metrics that measure both efficiency and the quality of the customers you're attracting.
Start with Cost per Acquisition (CPA) - this tells you how much you're spending to secure each conversion. The formula is straightforward: divide your total campaign spend by the number of conversions [23, 19]. For awareness campaigns, though, Cost per Engagement (CPE) might be a better fit. This metric divides your spend by the total interactions (likes, shares, comments, etc.) [23, 5]. Think of CPE as your go-to for top-of-funnel goals, while CPA is better suited for bottom-funnel sales objectives.
Another key metric is Return on Ad Spend (ROAS), which focuses solely on media efficiency by comparing revenue to ad spend. Unlike ROI, ROAS leaves out production costs, tools, and fees, giving you a clearer look at how well your ad dollars are working [6, 5]. Industry benchmarks for ROI in 2026 vary widely: e-commerce typically sees 300–500%, SaaS hits around 150–250%, and fashion or beauty averages 200–400%. Together, these metrics provide a more complete view of your campaign's performance beyond just ROI.
On platforms like TikTok and Instagram Reels, video completion rates and save rates often indicate genuine interest better than total views. Engagement benchmarks for 2026 show Instagram Reels averaging 3–6%, TikTok at 4–8%, and YouTube Shorts at 2–5%. Additionally, nano-influencers (1,000–10,000 followers) often deliver a 40% lower CPA compared to their macro-influencer counterparts.
Metrics Beyond Direct Sales
Here’s a quick look at some key metrics and their best use cases:
| Metric | Formula | Best Used For |
|---|---|---|
| CPE | Total Spend ÷ Total Engagements | Evaluating Awareness & Engagement Quality |
| CPA | Total Spend ÷ Total Conversions | Measuring Sales & Lead Generation Efficiency |
| ROAS | Total Revenue ÷ Ad Spend | Assessing Media Spend Efficiency |
| CLV | (Avg. Order Value × Frequency × Lifespan) - CAC | Tracking Long-Term Profitability & Loyalty |
| ROI | (Revenue - Total Costs) ÷ Total Costs × 100 | Gauging Overall Campaign Profitability |
Tracking Customer Lifetime Value (CLV) is especially useful for understanding the total revenue a customer generates over their relationship with your brand - not just from their first purchase.
Use CLV for Long-Term ROI Assessment
For a more comprehensive view, track Customer Lifetime Value (CLV) to distinguish loyal customers from one-time buyers. CLV can help you identify which influencers attract repeat customers versus those who drive only one-off purchases. For instance, in 2025, brands working with influencers saw a 31% boost in customer retention compared to traditional advertising methods.
To calculate CLV by influencer, try using cohort analysis. Group customers by the influencer who referred them, and monitor their spending over at least 12 months. The formula is:
(Number of Customers × Average Order Value × Purchase Frequency × Customer Lifespan) − Campaign Cost.
This approach accounts for the fact that promo codes often capture just 20–30% of influenced purchases. The remaining 70–80% of customers may buy later without using a code, so extending your attribution window to 30–45 days (rather than the standard 7 days) can help. This is especially crucial for higher-priced products or items with longer decision-making cycles.
Another useful comparison is churn rate. If customers acquired through influencers stick around longer and buy more frequently than those from other channels, it's a strong sign you're targeting the right audience. Nano and micro-influencers, in particular, shine here. Their close-knit communities often result in 45–60% repeat purchase rates. While mega-influencers (1 million+ followers) can deliver massive reach, their audiences may not be as loyal. On average, businesses earn $6.50 for every $1 spent on influencer marketing [2, 24]. Breaking this down by influencer size and pairing it with CLV data can reveal which partnerships are worth pursuing again.
Step 5: Measure Brand Awareness and Indirect Value
Direct revenue is essential, but the long-term impact of brand awareness can be just as important for ROI. Influencer campaigns often focus on goals like increasing awareness, improving sentiment, or introducing your brand to new audiences, instead of driving immediate sales. These indirect outcomes, while harder to track, can account for 40% to 60% of an influencer campaign's overall impact.
However, measuring this value is a challenge - 73% of brands struggle to demonstrate the effectiveness of their influencer campaigns. The primary hurdle? Assigning monetary value to metrics like reach, sentiment, or brand mentions. But with the right methods, these "soft" metrics can be quantified and integrated into ROI calculations.
Top Analytics Tools for Measuring Awareness
To measure awareness, start by tracking reach and impressions to estimate exposure. Then, use brand lift surveys to assess engagement. Conduct surveys before and after your campaign, asking questions like "Have you heard of [Brand Name]?" or "How likely are you to consider [Brand Name] for your next purchase?" The change in responses will reflect your brand lift .
AI-powered sentiment analysis tools can also help you track audience perception , while platforms like FoxMetrics offer behavioral tracking to deepen these insights . For example, Nivea's "Living in My Skin" podcast in 2024, featuring key influencers, saw a near 100% positive sentiment shift among its audience.
Additionally, monitor branded search spikes to gauge increased awareness. Share of Voice (SOV) - the volume of your brand mentions compared to competitors - is another key metric. For instance, a global fashion brand targeting Gen Z used Zigpoll analytics during a 2025 summer influencer campaign. The results? A 35% boost in website traffic, a 40% increase in positive mentions, and a 5x ROI when factoring in both direct sales and brand impact.
Once you've gathered these metrics, the next step is to translate them into financial terms.
Assign Dollar Value to Brand Awareness
To quantify awareness metrics, convert them into dollar amounts using methods like Earned Media Value (EMV). This approach estimates what you’d spend to achieve the same exposure through traditional advertising . The formula: EMV = (Total Impressions ÷ 1,000) × CPM. For example, 2,000,000 impressions at a $10 CPM would yield an EMV of $20,000.
Blended ROI modeling is another useful strategy, combining direct sales with estimated brand lift value. For instance, if a campaign boosts brand awareness by 15% and you estimate that translates to a 5% market share increase in a $10 million market, the resulting brand value could be approximately $500,000.
You can also calculate savings from repurposed influencer content. If an influencer provides high-quality content that you reuse across your channels, compare the cost of the partnership to what a professional studio shoot would have cost. Many brands save up to 52% on content creation this way.
"To truly measure influencer marketing ROI is to transform your program from a cost center into a proven growth engine." - Aspire
Finally, use post-purchase surveys or checkout questions to confirm influencer-driven awareness. Nestlé, for example, conducted a study in 2024 linking influencer exposure to grocery sales for DiGiorno and Hot Pockets. The results showed that consumers exposed to influencer content spent 25% more on these products than those who weren’t.
Step 6: Compare Individual Influencer Results
This step zeroes in on evaluating how each influencer contributes to your campaign's success. By comparing their performance side-by-side, you can identify which partnerships are thriving and which might be dragging down your overall ROI. Influencer marketing often aligns with the 80/20 principle, where just 5% to 10% of influencers are responsible for over 80% of the campaign's revenue.
To make smarter decisions for future collaborations, avoid being swayed by vanity metrics like follower count. For instance, a creator with 120,000 followers might bring in less revenue than someone with just 15,000 followers if the latter’s audience is more engaged with your brand. Nano-influencers (1,000–10,000 followers) often deliver a 400–600% ROI, while mega-influencers (1 million+ followers) typically generate only 100–200% ROI because their role leans more towards brand awareness than direct conversions.
Standardizing your evaluation with efficiency metrics like Cost Per Engagement (CPE) and Cost Per Order (CPO) helps account for differences in influencer fees and audience sizes. Nano-influencers, for example, usually have a 40% lower customer acquisition cost (CAC) compared to macro-influencers.
"To run a successful influencer program, set goals at a more granular level."
- Shane Barker, Digital Marketing Consultant
When calculating individual ROI, don’t overlook hidden costs such as product samples, shipping, platform fees, or boosting expenses, as these can vary greatly between influencers. Also, think about long-term benefits by tracking metrics like Customer Lifetime Value (CLV) and retention rates. Some influencers may drive one-time sales, while others help build a loyal customer base .
Create a Tracking Table
A performance tracking table is essential for comparing influencers effectively. It combines engagement data with financial results, giving you a clear picture of each creator's contributions. At a minimum, track the following:
- Influencer name
- Follower count
- Campaign cost
- Engagement rate
- Total clicks
- Revenue generated
- ROI percentage
Here’s an example of how your table might look:
| Influencer Name | Follower Count | Campaign Cost | Engagement Rate | Total Clicks | Revenue Generated | ROI % |
|---|---|---|---|---|---|---|
| Creator A | 15,000 | $500 | 8.5% | 450 | $2,500 | 400% |
| Creator B | 85,000 | $2,500 | 3.2% | 1,200 | $6,000 | 140% |
| Creator C | 120,000 | $5,000 | 1.5% | 900 | $4,500 | -10% |
To ensure accurate revenue attribution, use unique promo codes (e.g., NAME10) and UTM-tagged URLs for each influencer. For deeper insights, break the table down further by individual posts, allowing you to see which content types - like Reels, Stories, or static posts - perform best. Adding a column for Cost Per Engagement (CPE) can also help you compare efficiency across influencer tiers. For example, a nano-influencer might have a CPE of $0.50, while a macro-influencer’s could be closer to $1.50.
Finally, use this table to experiment with short-term tests involving influencers of various sizes. From there, focus your long-term partnerships on the top performers. This method not only optimizes your budget but also ensures you’re investing in creators who consistently deliver strong results. Use these insights to refine your strategy and build a more effective influencer mix.
Step 7: Tools and Resources for Measuring ROI
Using the right measurement tools takes the guesswork out of evaluating influencer campaigns. Did you know that 73% of brands struggle to prove influencer value?. That’s a big number, but the right tools can help you tackle this challenge.
When choosing tools, focus on features that solve common pain points. For instance, tools offering multi-touch attribution ensure influencers get credit across the entire customer journey. Look for privacy-first tracking options, like server-side tracking, which can recover 20-30% of lost conversion data. And don’t forget about fraud detection - with 35% of Instagram accounts showing signs of fake followers or bot activity, it’s a must-have feature.
Pricing for these tools varies widely. For basic campaigns, free options like InfluenceFlow and Google Analytics 4 are a good start. Mid-market solutions with features like influencer discovery and CRM integration typically cost $200–$2,000 per month, while enterprise-level platforms offering advanced AI-driven attribution can run $5,000–$10,000 or more per month. Integration capabilities are also key - make sure your tools work with platforms like Shopify, Salesforce, or HubSpot. This allows you to track metrics like Customer Acquisition Cost (CAC), Customer Lifetime Value (CLV), and Return on Ad Spend (ROAS) alongside direct revenue, giving you a full financial picture.
Marketing Analytics Tools Directory
Need help finding the right tool? The Marketing Analytics Tools Directory (https://topanalyticstools.com) is a one-stop shop for exploring platforms that support real-time analytics and campaign tracking. The directory organizes tools by functionality - such as campaign performance tracking, audience insights, A/B testing, and business intelligence - making it easier to compare options tailored to your needs. Whether you’re a small business seeking basic engagement tracking or an enterprise operation looking for advanced data-driven tools, this directory has you covered. It’s a great resource for finding solutions to automate reporting, monitor engagement quality, and integrate seamlessly with your marketing stack.
Conclusion
To measure influencer ROI, use the formula: ((Total Revenue – Total Costs) ÷ Total Costs) × 100. Make sure to include every expense - such as product seeding, platform fees, and other campaign costs - to get an accurate picture of your return. On average, businesses see $5.78 earned for every dollar spent when all costs are properly accounted for.
Incorporate multi-touch attribution to give credit to influencers who drive awareness early in the customer journey, even if conversions happen later. These indirect conversions can make up as much as 40% to 60% of an influencer's overall impact. To ensure accuracy, pair this approach with campaign tracking tools like unique promo codes, UTM parameters, and first-party data tracking, which are especially important as privacy regulations continue to evolve.
While ROI is essential, don't overlook non-revenue metrics. Metrics like brand lift and customer lifetime value (CLV) offer insights into the broader success of your campaigns. These indicators help you gauge whether you're fostering long-term customer loyalty or just driving short-term sales.
Track ROI on a monthly basis instead of waiting until a campaign ends. This allows you to quickly identify underperforming creators and reallocate your budget more effectively. Additionally, using a consistent 90-day attribution window ensures you account for the natural delay between initial exposure and eventual purchases.
FAQs
How can I accurately track all costs for an influencer campaign?
To keep tabs on all costs for an influencer campaign, start by setting clear goals and deciding on the key metrics that will gauge success. This way, your tracking efforts will stay aligned with what you want to achieve.
Make sure to log every expense tied to the campaign. This includes influencer payments, content creation fees, ad spend on platforms, and any extra promotional costs. To connect results to specific influencers or pieces of content, use tools like UTMs, promo codes, or detailed influencer performance reports. These tools make it easier to see what’s working and where.
Having a consistent system for tracking both expenses and outcomes is crucial. Reliable marketing analytics tools can simplify this process, helping you keep accurate records and gather the data you need to assess your campaign's ROI effectively.
What are the best tools to measure influencer campaign ROI?
To gauge the ROI of an influencer campaign, you’ll need tools that deliver real-time analytics, track essential performance metrics, and correctly attribute conversions. These tools often help evaluate audience quality, flag potential influencer fraud, and measure engagement, reach, and sales.
When choosing a tool, make sure it aligns with your campaign objectives. Focus on critical metrics like earned media value (EMV), conversion rates, and the overall impact on sales. Many platforms also offer features tailored to specific social media channels, such as Instagram or TikTok, so you can gather insights most relevant to your strategy. The best tool for you will depend on your goals and the metrics you prioritize, but ensuring data accuracy and actionable insights will be crucial for maximizing ROI.
How can I evaluate the long-term success of influencer campaigns beyond just immediate sales?
To gauge how well your influencer campaigns perform in the long run, focus on metrics that highlight customer loyalty and their connection to your brand over time. Start with Customer Lifetime Value (CLV). This metric shows the total revenue your brand earns from customers who were influenced by the campaign throughout their journey with you. It’s a great way to see the bigger picture of your campaign’s impact.
You’ll also want to keep an eye on repeat purchase rates and customer retention. These metrics reveal how engaged and loyal your customers remain after their initial interaction with your brand.
Another helpful strategy is evaluating influencer-attributed customer retention. This tells you how long customers stay loyal after discovering your brand through an influencer. Tools like CRM systems, unique promo codes, and advanced analytics can make tracking these metrics easier and help you figure out if your influencer partnerships are leading to lasting growth and stronger customer relationships.