Choosing between open-source and paid tools for real-time monitoring can be tricky, but it boils down to your budget, technical expertise, and business needs. Here’s a quick breakdown:
- Open-Source Tools: Offer full data ownership, no licensing fees, and customization options. However, they require technical skills, regular maintenance, and can have hidden operational costs.
- Paid Tools: Provide ease of use, dedicated support, and advanced features like cross-channel data integration. They’re great for teams with limited technical expertise but come with subscription fees that can scale with data volume.
Quick Overview:
- Open-Source: Best for teams with strong technical skills needing full control over data.
- Paid: Ideal for businesses prioritizing ease, scalability, and support.
Key takeaway: Open-source tools save on licensing but demand technical resources. Paid tools simplify processes but come with ongoing costs. Choose based on your team’s skills, budget, and growth plans.
Open-Source Tools: Features, Benefits, and Challenges
Key Features of Open-Source Tools
Open-source monitoring tools offer real-time dashboards that update instantly, providing insights into custom events like clicks, form submissions, and video plays, alongside traditional metrics like pageviews. These tools are designed to help you track user interactions across your campaigns using website analytics tools seamlessly.
One standout feature is complete data ownership. By self-hosting, all your data stays on your servers, ensuring no third party can access or monetize it. Additionally, the source code is publicly available, which allows for transparent security audits to confirm there are no hidden trackers. Many tools now support cookieless tracking and adhere to GDPR and CCPA regulations, often removing the need for consent banners altogether.
Another strength is their developer-friendly integration. With robust REST APIs and SDKs for popular frameworks like React, Next.js, Swift, and Python, these tools can easily integrate into your existing tech stack. These features form the foundation for the benefits discussed next.
Advantages of Open-Source Tools
One of the biggest perks? Zero licensing fees - you don’t pay for the software itself. Plus, full data ownership ensures your information isn’t repurposed by vendors for advertising or research purposes. This also means you get unsampled, 100% accurate reports, giving you full confidence in your data.
"The fundamental promise of open source analytics is simple: Your data belongs to you. It eliminates the risk of your analytics provider using your user data for their own purposes." – Swetrix
Open-source tools also free you from vendor lock-in. You can modify the software or migrate your data to different hosting environments without being tied to proprietary systems. Access to the source code allows for deep customization to meet unique tracking needs. A great example of this is when the Czech government transitioned its national portals from Google Analytics to a self-hosted Matomo instance between 2020 and 2021. This move ensured all citizen data remained within EU borders and under government control. Additionally, around 90% of PostHog users opt for its free cloud tier or open-source version, highlighting the accessibility of these tools.
Challenges of Using Open-Source Tools
Despite the advantages, open-source tools come with operational hurdles that require technical expertise and careful budgeting.
For starters, many marketers lack the DevOps skills needed to manage systems like Docker, Kubernetes, or PostgreSQL. Self-hosting means you’re responsible for handling software updates, security patches, backups, and ensuring server uptime. For example, PostHog recommends at least 4 vCPUs and 16 GB of RAM for self-hosting, and advises against exceeding 300,000 events per month.
"The uncomfortable truth: open source doesn't eliminate cost - it shifts it from licensing to operations." – Tinybird Team
Operational costs can also pile up quickly. While basic VPS hosting might cost $6–$12 per month, production-ready servers range from $40 to $80 monthly. Add to that developer time, which averages about $75 per hour for maintenance tasks. Some tools also require paid plugins for essential features. For instance, Matomo’s Funnels plugin costs $199 per year, while its Heatmaps & Session Recording add-on is $249 annually.
Another challenge is the lack of dedicated support. Many tools rely on community forums for troubleshooting, which can delay problem resolution. You’ll also need to manage your own security hardening and access controls. Self-hosted setups may struggle with high traffic volumes, which is why the majority of PostHog users - about 90% - prefer its managed cloud option over self-hosting.
sbb-itb-5174ba0
Paid Tools: Features, Benefits, and Challenges
Key Features of Paid Tools
Paid tools address many of the limitations seen in self-hosted systems by offering streamlined solutions for real-time monitoring.
One standout feature is real-time data access, which eliminates the delays often found in free tools that rely on batch processing. Premium platforms update data instantly and bypass sampling, ensuring precise results even during high traffic periods. This level of accuracy is critical for businesses that depend on timely marketing insights.
Another key aspect is advanced attribution modeling. These tools integrate data from ad platforms, CRMs, and multiple marketing channels to identify the touchpoints that drive conversions. Additionally, built-in compliance features simplify adherence to regulations like GDPR, CCPA, and HIPAA.
Paid tools are also designed to be user-friendly, with intuitive interfaces that reduce the learning curve. This allows teams to start deriving insights without needing extensive training.
Bot filtering is another critical feature. Paid platforms automatically filter out referrer spam and bot traffic, which is especially useful for tech-savvy audiences. For example, platforms like Reddit and Hacker News report that around 58% of their users deploy ad blockers, a factor that can distort data in free tools.
These features not only improve data accuracy but also make the tools easier to use, saving time and effort for teams.
Advantages of Paid Tools
Paid tools offer a range of conveniences, starting with plug-and-play implementation. Automatic updates and vendor-managed security eliminate the need for DevOps involvement, freeing up internal resources. Unlike free tools that often rely on community forums for support, paid platforms provide dedicated human assistance, often backed by Service Level Agreements (SLAs).
Privacy-focused platforms like Plausible and Fathom have gained traction, experiencing 200% growth in 2026, as marketers increasingly seek GDPR-compliant solutions without the hassle of self-hosting. Entry-level pricing for paid tools can start at just $9 per month, with average plans around $75. For businesses with significant ad spends - over $10,000 per month - the enhanced compliance and cross-channel attribution features can deliver a strong return on investment.
Another benefit is scalability. Paid platforms offer tiered pricing based on event volume, accommodating anywhere from 10,000 to over 50 million events. This flexibility ensures that businesses aren't constrained by infrastructure limitations. The time saved by automating processes often offsets the cost of upgrading to a paid solution.
These advantages make paid tools an appealing choice for businesses looking to streamline operations and enhance data accuracy.
Challenges of Using Paid Tools
Despite their benefits, paid tools come with challenges, starting with costs. While entry-level plans are relatively affordable, enterprise-level solutions like Google Analytics 360 can range from $50,000 to $150,000 annually. These expenses often increase as traffic grows.
Another challenge is vendor dependency. Since the vendor controls updates, pricing, and data policies, businesses may find themselves at the mercy of changes outside their control. Additionally, 44% of marketers report difficulty in extracting actionable insights from complex platforms like Google Analytics 4.
Implementing these tools also requires additional resources beyond the subscription fee. Expertise in software development and data analysis is often necessary to fully utilize their capabilities. In fact, 78% of organizations cite a lack of staff time as a major hurdle, while 68% point to gaps in technical knowledge. Poorly configured systems can lead to alert fatigue, where false positives drain resources. Some teams even collect data simply to satisfy stakeholders, rather than using it to drive strategy, which diminishes the tool's overall value.
These challenges highlight the importance of carefully evaluating the total cost of ownership and ensuring the organization has the capacity to maximize the tool's potential. Balancing these factors is key to making an informed decision.
Open-Source vs. Paid Tools: Side-by-Side Comparison
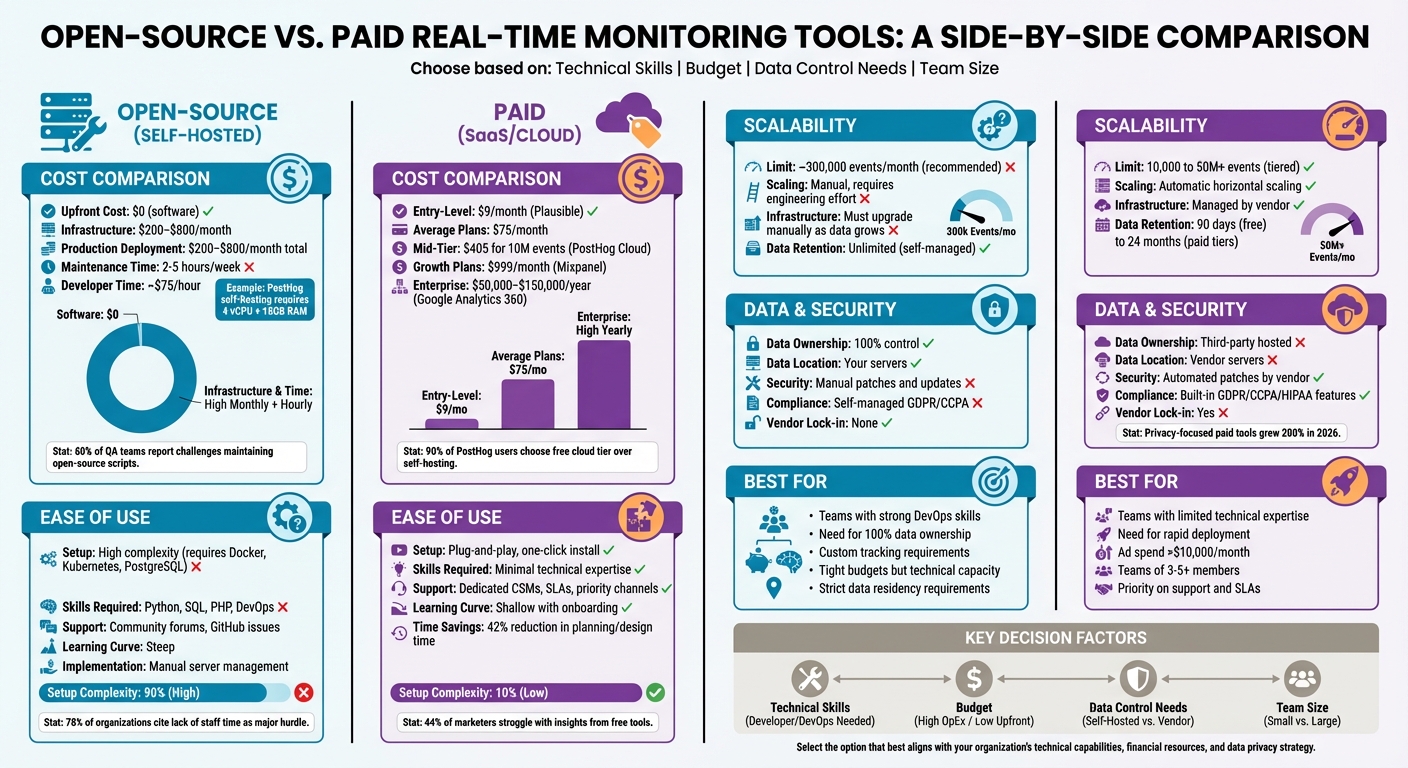
Open-Source vs Paid Real-Time Monitoring Tools: Cost, Features, and Implementation Comparison
Cost Comparison
Open-source tools might not have licensing fees, but they come with other expenses. Expect production deployments to cost between $200 and $800 per month, plus the need for 2–5 hours of weekly maintenance. These costs can add up over time.
Paid tools, on the other hand, start at $9/month for options like Plausible, which focuses on privacy. The average entry price for paid platforms is around $75/month, but costs can skyrocket as data volume increases. For example, Mixpanel's pricing jumps from a free tier to $999/month for its Growth plan. PostHog Cloud offers a free tier for up to 1 million events per month, covering most of its users, but charges $405 for 10 million events. High-end enterprise solutions like Google Analytics 360 can reach $150,000 annually.
"PostHog Cloud at $450/month for 20M events is often cheaper than self-hosting once you account for DevOps time." – Marc Dubois, Marketing & Sales Technology Analyst
When calculating Total Cost of Ownership (TCO), it’s important to include hidden costs like security updates and DevOps time. Many teams discover that paying for a managed service ends up being more cost-effective than maintaining their own infrastructure.
Ease of Use and Implementation
Cost isn’t the only factor to weigh - ease of use is another big consideration. Paid platforms are known for their plug-and-play functionality, allowing teams to start analyzing data almost immediately. These tools often come with polished interfaces, pre-built integrations with CRM and advertising platforms, and structured onboarding processes supported by dedicated teams.
Open-source tools, however, require a higher level of technical expertise. Teams need to be familiar with programming languages like Python, SQL, or PHP, as well as manual server management and integration tasks. This difference in complexity can have a real impact on timelines. Paid platforms can cut planning and design time by up to 42%, while about 60% of QA teams report challenges in maintaining open-source scripts due to limited coding skills.
Another challenge with open-source tools is ongoing maintenance. Security patches and updates must be handled manually, whereas paid vendors take care of these tasks automatically. For support, open-source users typically turn to community forums or GitHub issues, which can lead to inconsistent response times and solutions.
Scalability and Performance
Both open-source and paid tools can scale, but they approach the challenge differently. Paid platforms are designed for automatic growth, with horizontal scaling and multi-tenancy built into their systems. Open-source tools, while technically unlimited, require significant engineering effort to scale. For instance, self-hosting becomes increasingly complex as data volumes grow, with manual upgrades and infrastructure management creating bottlenecks. Experts suggest self-hosting is manageable only for up to 300,000 events per month, after which cloud solutions simplify scaling.
Infrastructure demands also rise with data volume. A basic self-hosted PostHog instance requires at least 4 vCPU and 16GB RAM. As data accumulates, additional manual upgrades and performance tuning become necessary. Paid tools eliminate this overhead entirely, offering a hassle-free experience.
Data retention is another factor to consider. Free tiers of paid tools often limit historical data to 90 days, requiring upgrades - often around $1,000/month - for longer-term comparisons. Paid tiers for tools like Mixpanel and Amplitude include 24-month data retention, making long-term analysis more straightforward.
Support and Maintenance
Support and maintenance highlight another key difference between these options. Paid platforms provide dedicated Customer Success Managers, Service Level Agreements (SLAs), and priority support channels, ensuring fast and reliable assistance. Open-source tools, by contrast, rely on community-driven support through forums, Discord, and GitHub, which can vary in availability and resolution speed.
Maintenance responsibilities also differ significantly. Paid vendors handle security patches, feature updates, and infrastructure improvements, freeing up teams to focus on data analysis. Self-hosted open-source tools, however, require continuous attention - everything from applying updates to troubleshooting server performance must be managed in-house. This can divert resources away from other priorities.
Ultimately, the choice boils down to control versus convenience. Open-source tools offer complete data ownership and the freedom to customize, while paid platforms provide managed services that minimize technical workloads but come with trade-offs in control.
Comparison Table: Open-Source vs. Paid Tools
| Factor | Open-Source (Self-Hosted) | Paid (SaaS/Cloud) |
|---|---|---|
| Upfront Cost | $0 (Software) | $9 - $999+ per month |
| Infrastructure | $200 - $800/mo (Server/Storage) | Included in subscription |
| Maintenance | 2-5 hours/week (Manual) | Managed by vendor |
| Support | Community/Forums | Dedicated Support/SLAs |
| Data Ownership | 100% Control | Third-party hosted |
| Scalability | Limited by hardware/DevOps | High (Elastic/Horizontal) |
| Setup Complexity | High; requires server/Docker/code config | Low; often one-click or script install |
| Learning Curve | Steep; requires technical training | Shallow; includes onboarding/support |
How to Choose the Right Tool for Your Marketing Needs
Identify Your Business Requirements
When picking the right marketing analytics tools, start by evaluating your Total Cost of Ownership (TCO) rather than just the subscription fees. Open-source tools may save you money on licensing, but they come with operational costs - like engineering time for integration, maintenance, and infrastructure. Assess your team’s technical skills, as open-source options require expertise in SQL, DevOps, and distributed systems, unlike the more user-friendly setup of paid tools.
Your advertising budget can also guide your decision. If your ad spend is under $10,000 per month, Google Analytics 4 is often enough. Premium tools are worth considering only if you need advanced cross-channel attribution or privacy compliance. Team size is another factor - free or open-source tiers work well for small teams of 1–3 people, but larger teams (more than 3–5 members) may find paid plans essential to avoid workflow bottlenecks.
Data complexity plays a big role too. If you’re connecting more than four data sources or require advanced features like scheduled reports or embedded analytics, a paid tool might be necessary. Before committing, test any platform with your actual data and workflows for at least a week. Demos and reviews can’t match the insights you’ll gain from hands-on testing.
This kind of assessment helps you decide whether an open-source or paid solution fits your operational and strategic goals.
When to Choose Open-Source Tools
Open-source tools are ideal for teams with strong technical expertise and a need for full control over their data. If your campaigns require 100% data ownership or custom code to meet regulatory or specialized needs, open-source platforms are a solid choice. Self-hosting also ensures control over data residency, which is crucial for meeting strict GDPR requirements.
These tools work best for teams with tight budgets but strong technical skills. However, keep infrastructure needs in mind - hosting a platform like PostHog requires at least 4 vCPU and 16GB RAM. As event volumes grow (beyond 300,000 per month), PostHog suggests switching to cloud-managed versions to handle the increased complexity.
Open-source solutions shine when customization and data sovereignty are more important than rapid deployment.
When to Choose Paid Tools
Paid tools are the way to go when speed to market is your priority, and your team lacks advanced technical expertise. They’re especially valuable when you need dedicated support or Service Level Agreements (SLAs) to ensure business continuity. Mengying Li, Data Science Manager at Notion, highlighted how switching to a paid tool transformed their operations:
"We transitioned from conducting a single-digit number of experiments per quarter using our in-house tool to orchestrating hundreds of experiments... with the help of Statsig".
Similarly, Sumeet Marwaha, Head of Data at Brex, shared:
"Our engineers are significantly happier... They no longer deal with uncertainty and debugging frustrations".
Even a modest price increase - say, $20 more per month - can deliver a strong ROI if it saves your team 10 hours per week. This advantage becomes more pronounced as your team grows. In fact, 44% of marketers report struggling to generate actionable insights from free tools like Google Analytics 4 due to their complexity.
Paid tools are worth the investment when efficiency, scalability, and support are top priorities.
Conclusion
Key Takeaways
Deciding between open-source and paid tools depends on several factors: your team's technical skills, overall costs (including both licensing and labor), and how quickly you need results. Open-source tools come with no licensing fees and allow for complete customization. However, they demand strong DevOps expertise and ongoing maintenance, with infrastructure and staffing costs ranging from $5,000 to over $26,000 per month.
Paid tools, on the other hand, offer quicker implementation and access to dedicated support, making them a good choice when time is of the essence. These tools can speed up decision-making by 30% and enhance employee efficiency by 40%. The downside? Subscription fees, which start at around $75 per month for basic plans, often end up costing 30% more than companies initially estimate.
Both options present security challenges. While 67% of developers express concerns about vulnerabilities in open-source tools, 85% of organizations using open-source reported at least one security incident in 2022. Proprietary tools are not exempt either - 90% of cybersecurity breaches in 2021 were tied to vulnerabilities in proprietary software. Ultimately, security depends on how well your team manages updates, patches, and compliance requirements.
These points highlight the importance of choosing top analytics tools that fit your operational needs and capabilities.
Final Thoughts on Real-Time Monitoring Tools
When selecting a tool, prioritize your operational requirements over budget alone. For smaller teams (fewer than three members) or ad spends under $10,000 per month, free tools like Google Analytics 4 might suffice. That said, 44% of marketers report difficulty in extracting actionable insights from such tools due to their complexity.
A hybrid approach often works best - using paid platforms for standard reporting and ease of access , such as social media analytics tools, while turning to open-source tools for custom data engineering tasks. To make an informed choice, conduct a Total Cost of Ownership (TCO) analysis that includes infrastructure, labor, and potential downtime costs, which can average $150,000 annually per incident for some organizations. The right tool is the one that aligns with your team's skills and marketing objectives without introducing unnecessary obstacles.
FAQs
How do I estimate total cost of ownership (TCO)?
When calculating the total cost of ownership (TCO) for real-time monitoring tools, it's important to look beyond just the initial purchase price or licensing fees. You'll need to account for both direct and indirect costs that come with using these tools.
Key factors to consider include expenses for skilled personnel, implementation, maintenance, security measures, and ongoing management.
For open-source tools, while they might seem cost-effective upfront, they often require a significant investment in technical expertise and additional security measures. On the other hand, paid tools typically come with predictable subscription fees that often include support and updates. While this can help minimize hidden costs, it does mean higher upfront expenses.
When should I switch from self-hosted to cloud?
If you're looking to simplify operations, scale effortlessly, or cut back on maintenance hassles, cloud analytics might be the way to go. These solutions offer quick setup, predictable costs, and the flexibility to grow as your needs evolve. For teams without the bandwidth to handle a self-hosted system - or those not bound by strict regulations requiring on-premises storage - shifting to the cloud can save both time and reduce potential risks.
What data should I track in real time?
When it comes to real-time monitoring, it’s all about keeping an eye on the numbers that directly influence your campaign’s success and how your audience interacts with your content. Here are the key video metrics you should prioritize:
- Watch Time: The total amount of time viewers spend watching your videos.
- Audience Retention: How long viewers stay engaged before dropping off.
- Click-Through Rate (CTR): The percentage of viewers clicking on your call-to-action or links.
- Engagement: Interactions like likes, comments, shares, and more.
- Conversions: Actions taken by viewers that align with your campaign goals, like purchases or sign-ups.
Beyond video-specific metrics, keep tabs on broader campaign data, such as:
- Overall Engagement: A measure of how actively your audience interacts with your campaign.
- Sentiment Analysis: Gauging the tone and emotion behind audience feedback.
- Impressions: The number of times your content is displayed.
- Campaign Conversions: Tracking the ultimate outcomes of your efforts.
By consistently monitoring these metrics, you can quickly spot problems like decreasing engagement or ads that aren’t performing well. This allows you to make timely adjustments, keeping your campaigns effective and ensuring you’re getting the best return on investment in today’s fast-moving digital landscape.