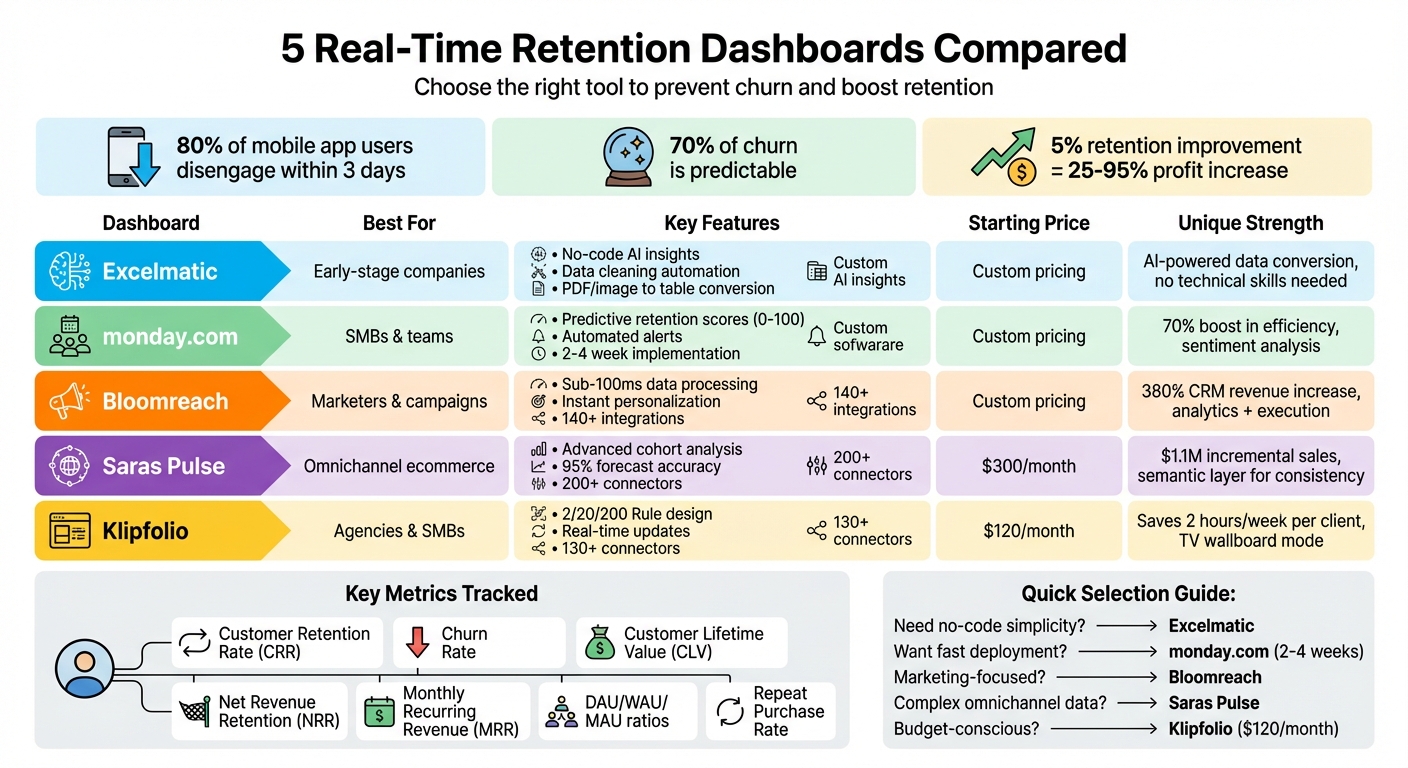
Real-time retention dashboards help businesses track user behavior and prevent churn before it happens. These tools analyze when and how users return after their first interaction, providing actionable insights to improve engagement and retention. With over 80% of mobile app users disengaging within three days, and 70% of churn being predictable, having the right dashboard is crucial for growth, especially as real-time data improves marketing decisions and retention strategies.
Here are five standout platforms for retention tracking:
- Excelmatic: No-code, AI-powered dashboard for early-stage companies. Simplifies data analysis and trend detection without technical skills.
- monday.com: Combines sales, support, and product data with predictive retention scores and automated alerts.
- Bloomreach: Integrates analytics with campaign execution, offering instant personalization and churn predictions.
- Saras Pulse: Advanced cohort analysis with real-time insights and predictive models for omnichannel businesses.
- Klipfolio: Focuses on quick, actionable insights with real-time updates and customizable metrics.
Each tool offers unique features for businesses of different sizes and needs. Below is a quick comparison to help you choose the right one.
Quick Comparison
| Dashboard | Best For | Key Features | Starting Price |
|---|---|---|---|
| Excelmatic | Early-stage companies | No-code, AI insights, data cleaning | Custom pricing |
| monday.com | SMBs & teams | Predictive scores, automated alerts | Custom pricing |
| Bloomreach | Marketers & campaigns | Instant personalization, churn prediction | Custom pricing |
| Saras Pulse | Omnichannel businesses | Cohort analysis, predictive models, SQL access | $300/month |
| Klipfolio | Agencies & SMBs | Real-time updates, customizable metrics | $120/month |
These dashboards turn retention data into actionable strategies, helping businesses retain users and boost revenue.
Real-Time Retention Dashboard Comparison: Features, Pricing, and Best Use Cases
Customer Cohort And Retention Analysis: Interactive Dashboard
sbb-itb-5174ba0
1. Excelmatic Early-Stage Retention Dashboard
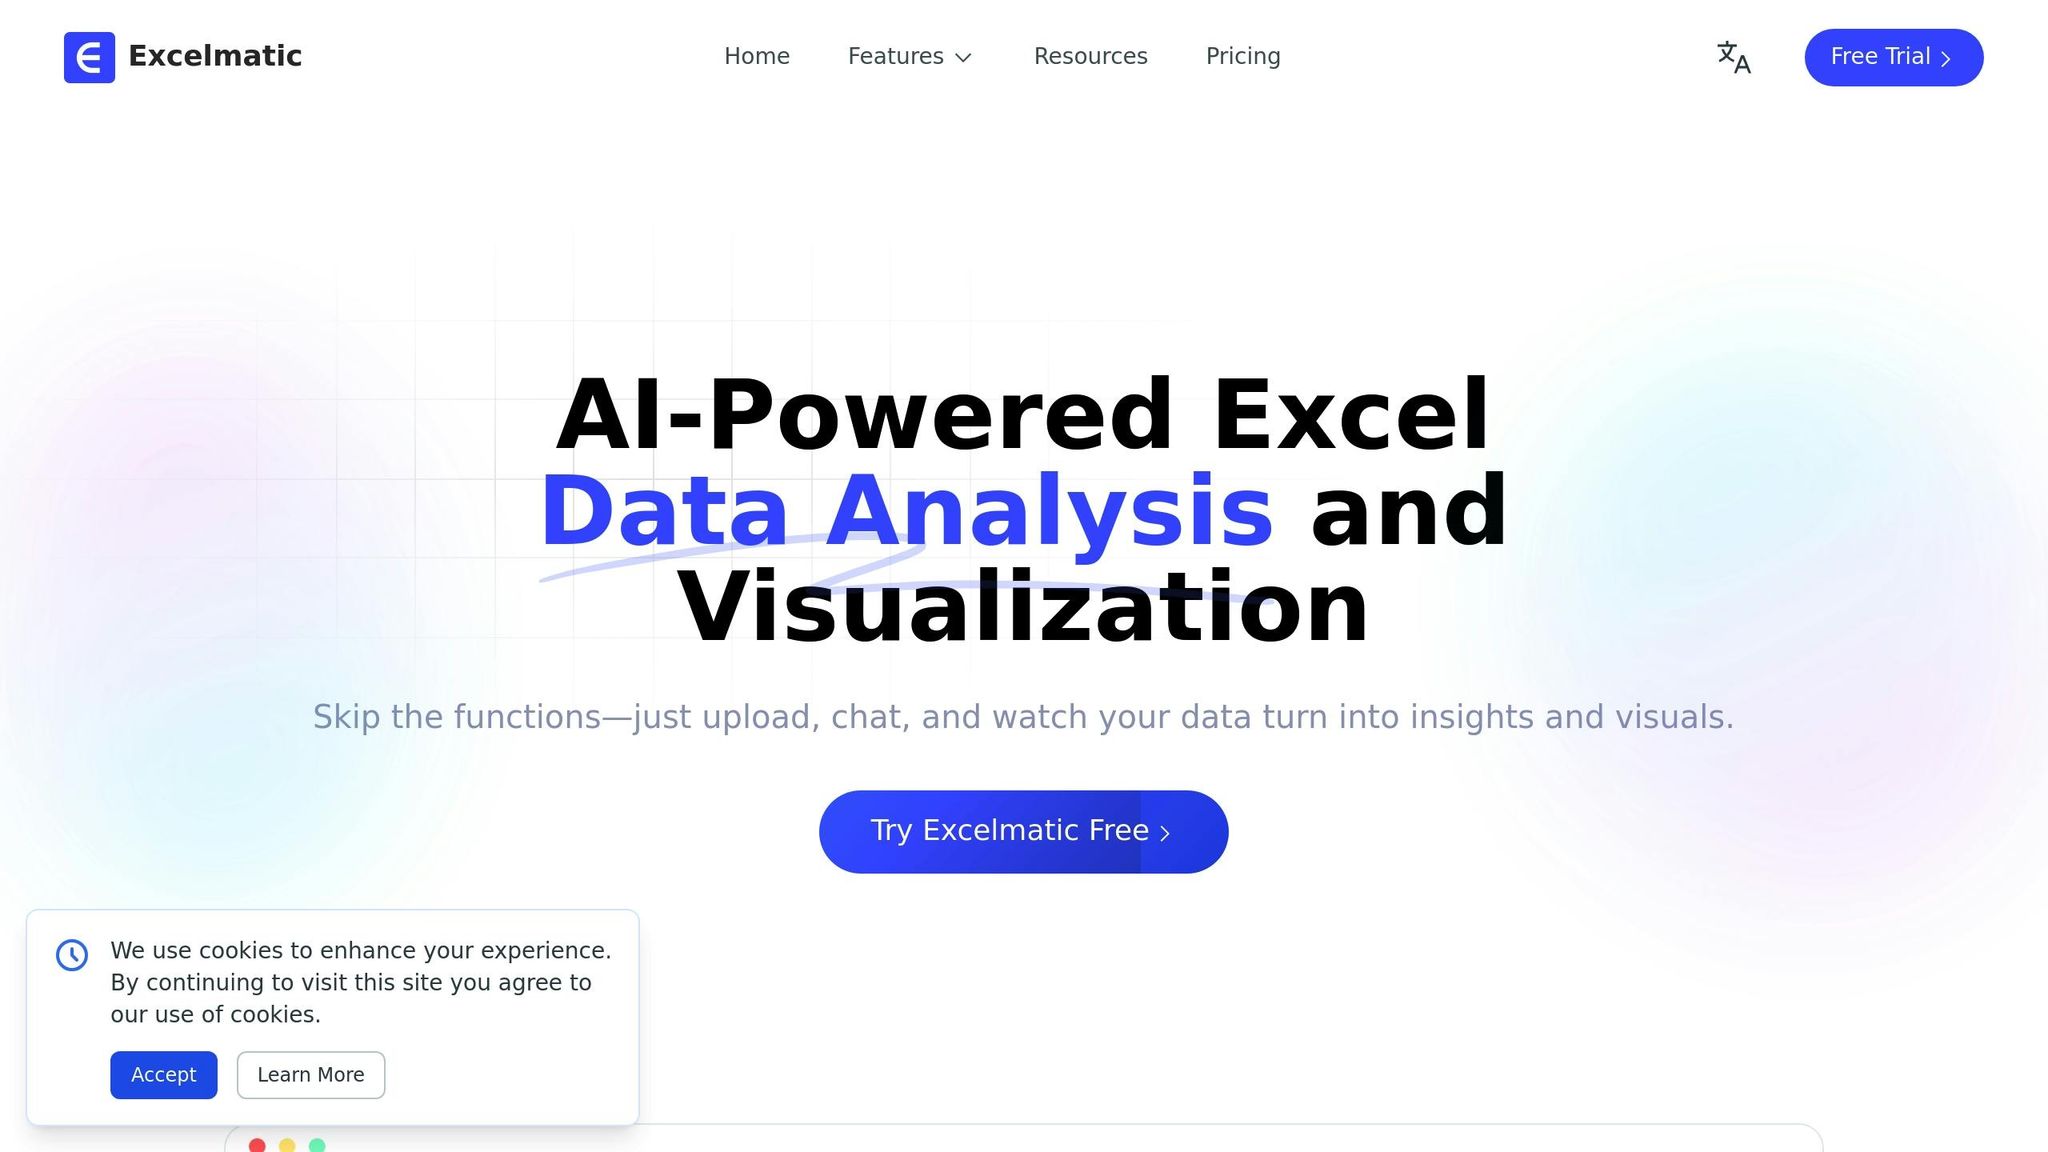
Excelmatic brings retention intelligence straight into spreadsheets, making it easy to analyze data without needing SQL skills or complex modeling. Users can ask questions like "What is the revenue trend?" or "Show me customer behavior patterns", and the AI instantly generates visual answers.
Metrics Tracked
The dashboard monitors customer behavior, revenue trends, sales growth, and custom KPIs tailored for early-stage retention analysis. One standout feature is its AI's ability to detect trends and outliers that are often missed by non-technical teams. These insights integrate seamlessly into the platform’s data tools.
Data Sources
Excelmatic connects with Excel files, CSVs, and other common data formats, similar to other top analytics tools for business. It even uses AI to transform PDFs and images into structured tables. This solves a major problem for early-stage companies, where retention data often exists in scattered formats. Gogo from Excelmatic explains:
"Most organizations today are not short on data. They are short on clarity."
The platform also automates data cleaning and formatting, which eliminates the need for manual preparation.
Real-Time Capabilities
By combining tracked metrics and integrated data, Excelmatic delivers real-time insights. Users can interact with the AI to get business answers in seconds. Beyond just surfacing data, the AI provides actionable recommendations to improve business performance. It also allows users to preview changes and refinements before exporting results, streamlining the decision-making process when time is critical.
Unique Strengths
Excelmatic is entirely no-code, setting it apart from tools that still require knowledge of data structures. This makes it ideal for managers and business operators who need to maintain dashboards without depending on data scientists. The no-code design allows for quick, informed decisions without technical barriers. Gogo highlights this shift:
"Data visualization no longer feels like a separate task or a technical hurdle. It becomes a natural extension of thinking through the data."
Additionally, Excelmatic shines in format cleaning and AI-assisted data conversion, making it a powerful tool for retention analysis.
2. monday.com Real-Time Retention Dashboard
monday.com brings together sales, support, and product usage data into a single, continuously updated view. Unlike traditional dashboards that depend on outdated weekly or monthly spreadsheets, this platform refreshes automatically with incoming data, eliminating delays and ensuring decisions are based on the most current information. This real-time integration lays the groundwork for tracking detailed metrics and triggering actionable alerts.
Metrics Tracked
The dashboard keeps tabs on key performance indicators (KPIs) like Customer Retention Rate (CRR), churn rate, and Customer Lifetime Value (CLV). It also tracks deeper engagement metrics such as Daily, Weekly, and Monthly Active Users (DAU/WAU/MAU) and their ratios (e.g., DAU/MAU). Revenue metrics like Net Revenue Retention (NRR) and Monthly Recurring Revenue (MRR) Retention are also highlighted. For context, top-tier B2B SaaS companies report a median NRR of 113%, while lower-performing peers average 98%.
One standout feature is the AI-powered Predictive Retention Score, which ranges from 0 to 100. This score forecasts the likelihood of a customer staying active by analyzing usage patterns and the tone of customer interactions. Notably, companies that implement advanced value-realization strategies often achieve a seven-percentage-point higher NRR compared to those with simpler approaches.
Data Sources
The platform consolidates sales activities, customer communications (like emails and calls), and support tickets into a unified timeline, breaking down data silos. It also integrates seamlessly with website analytics tools, giving teams a complete view of the customer journey without the need to toggle between systems. Elizabeth Gerbel, CEO, emphasizes the importance of this streamlined approach:
"Now we have a lot less data, but it's quality data. That change allows us to use AI confidently, without second-guessing the outputs."
These consolidated data streams enable the platform’s proactive intervention tools to function effectively.
Real-Time Capabilities
monday.com’s real-time metric widgets update automatically. Automated alerts notify teams as soon as customers hit risk thresholds - like a 50% drop in usage or 14 days of inactivity - allowing for timely action to prevent churn. For example, Ray White reported a 70% boost in administrative efficiency thanks to automated workflows and enhanced real-time visibility.
The platform also uses AI to detect negative sentiment in customer emails and condenses months of interactions into clear, actionable summaries for account managers. This feature helps teams spot potential issues like reduced engagement or bottlenecks before they escalate.
Unique Strengths
A drag-and-drop dashboard builder with pre-made templates allows non-technical users to create detailed dashboards without needing IT support. Samuel Lobao, Contract Administrator at Strategix, highlights this flexibility:
"With monday CRM, we're finally able to adapt the platform to our needs - not the other way around. It gives us the flexibility to work smarter, cut costs, save time, and scale with confidence."
The platform also connects insights directly to actions. For example, if a customer’s usage drops, the system can automatically assign a task to a Customer Success Manager. With an implementation timeline of just 2–4 weeks - compared to the months often required for traditional BI tools - monday.com ensures that retention data leads to immediate, actionable responses. This integration of real-time insights with prompt execution makes it a powerful tool for tackling customer retention challenges head-on.
3. Bloomreach Retention Dashboard

Bloomreach takes customer data analysis a step further by seamlessly integrating it with campaign execution across email, SMS, and web channels. This setup eliminates the usual delay between gaining insights and acting on them, making it easier to tackle retention challenges head-on.
Metrics Tracked
The dashboard keeps tabs on key metrics like repeat purchase rates, customer lifetime value (CLTV), average time between orders, and return rates. It also provides features such as "last month's retention" and cohort analysis, helping you identify trends faster. Another useful tool, the Session Return Funnel, focuses on non-subscriber behavior to uncover conversion opportunities.
Bloomreach’s AI engine, Loomi, takes things further by predicting churn probability and identifying "serial returners" - customers who frequently buy and return items. These insights make it easier to distinguish loyal customers from those who might be draining resources. For example, Arriva UK Bus used these dashboards to segment their audience and boost CRM revenue by 380%, while also improving email open rates by 14%.
Real-Time Capabilities
Bloomreach processes customer data in under 100 milliseconds, enabling instant personalization and re-engagement campaigns when customer behavior changes. This speed is a game-changer: businesses using Bloomreach’s top analytics tools and prebuilt dashboard templates have saved over 1,720 hours compared to manually creating reports.
One user from a mid-sized company shared their experience:
Customer tracking and customer management - Bloomreach is automatizing it all, reducing the time you need to track and manage all this. It allows you to set analytics templates, so you may track all data relevant to you, and great dashboards with insights, so other team members can check the data in real time without your help.
Data Sources
Bloomreach consolidates data from email, SMS, web, and mobile interactions into a single, unified customer view. By using identity resolution, it ensures accurate profiles even when customers switch devices or interact through various channels. To power the retention dashboard, businesses need to track specific events like consent actions, purchases (including total price and status), cart updates, and session starts.
With over 140 third-party integrations, the platform connects seamlessly with tools you’re already using. Unlike session-based platforms like Google Analytics, Bloomreach focuses on first-party data to track individual customer journeys, offering a clearer view of loyalty trends over time.
Unique Strengths
What sets Bloomreach apart is its ability to combine analytics with execution, allowing marketers to activate campaigns directly from the platform. Its conversational analytics interface, powered by Loomi AI, makes it easy to create custom retention reports without needing technical skills, potentially cutting data analysis time by 25%.
The platform’s 4.6/5 rating, based on over 570 reviews, highlights its strong automation features. Users particularly appreciate the prebuilt templates for retention, RFM segmentation, and cohort analysis, which significantly cut down setup time compared to traditional tools. For businesses leveraging offline purchase data, Bloomreach has driven a 27% increase in conversion rates, while segmentation-based insights have boosted Google Ads conversions by 63%.
4. Saras Pulse Cohort and LTV Retention Dashboard
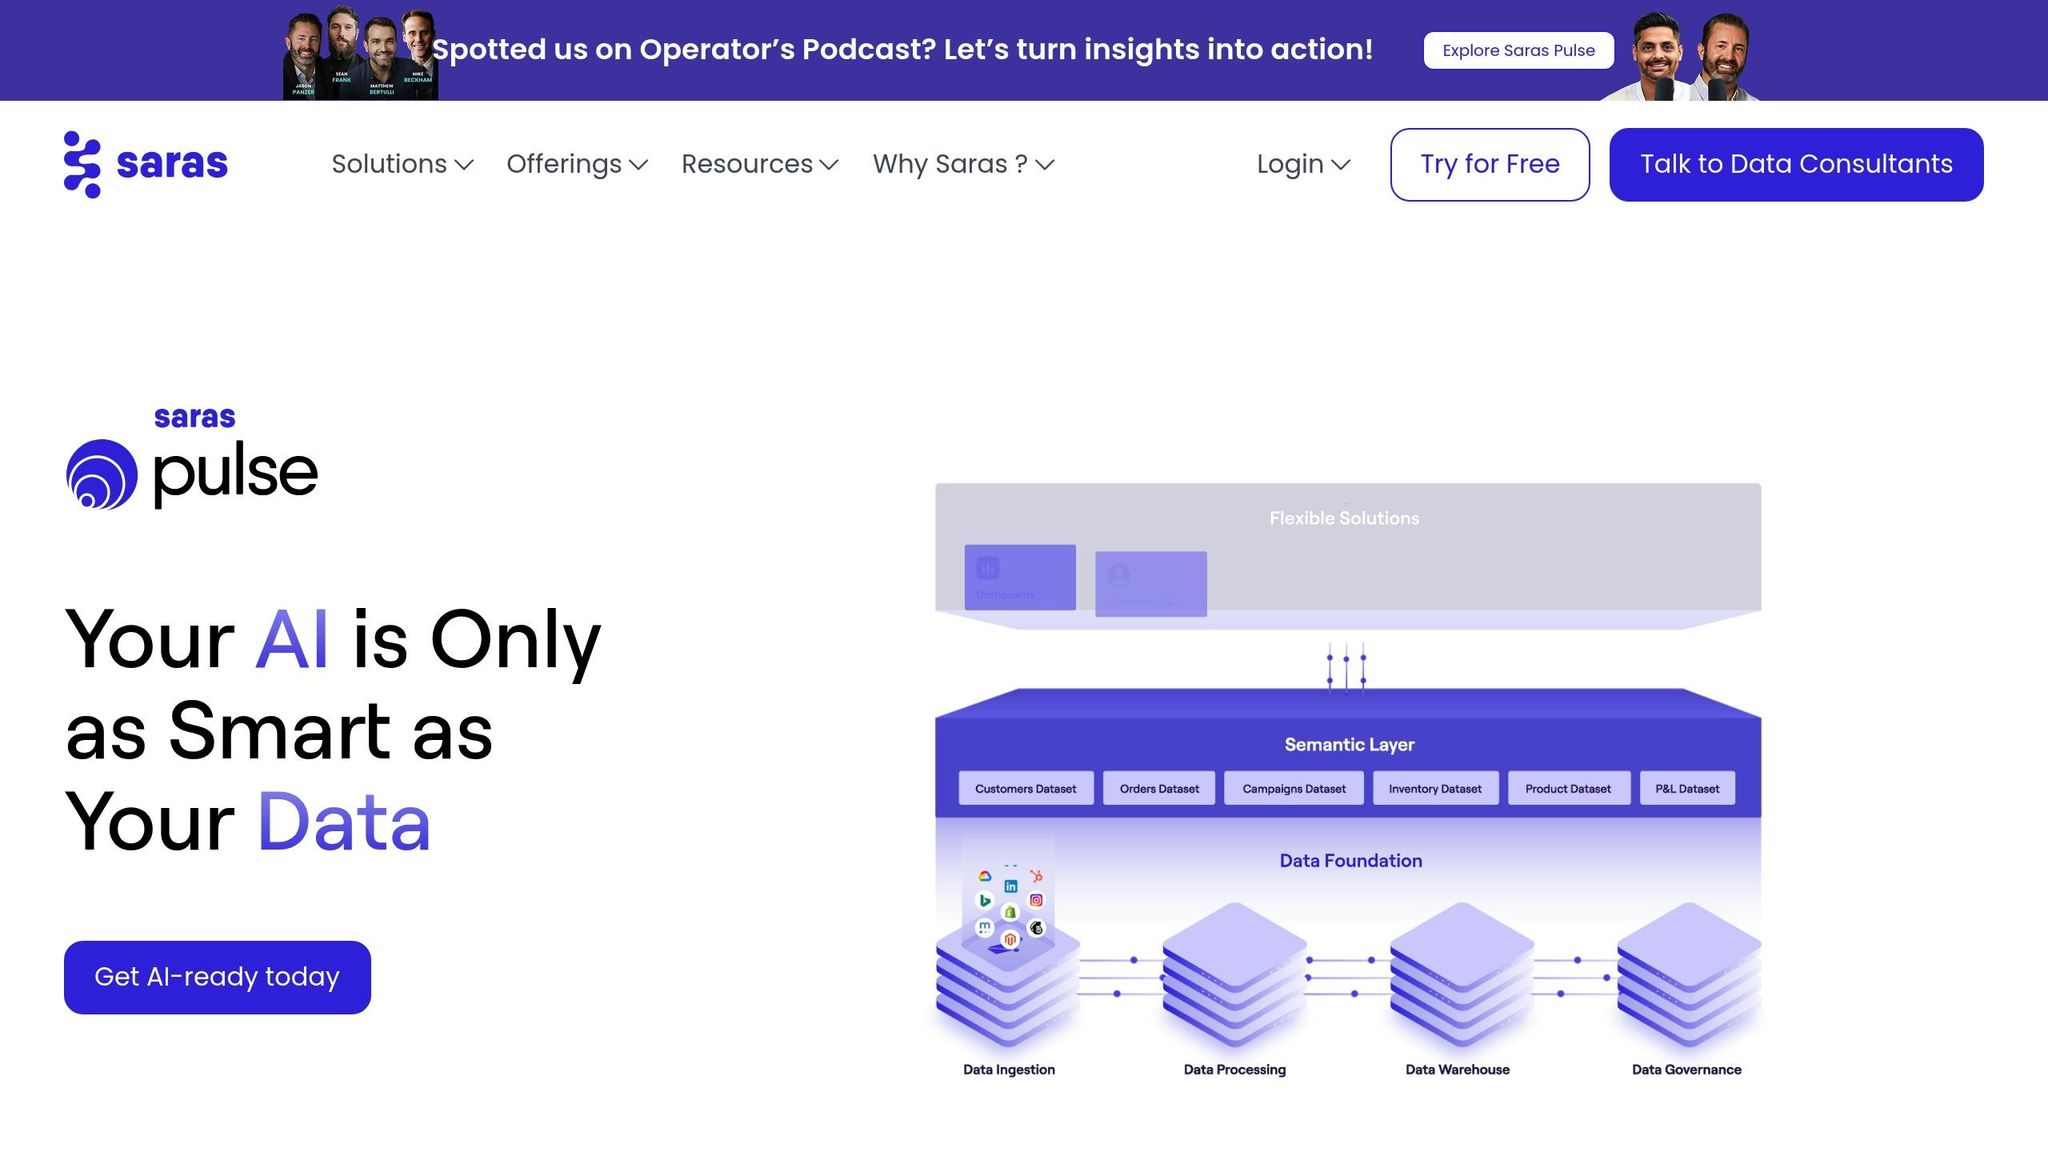
Saras Pulse treats retention data as a foundational element, offering a managed data warehouse through BigQuery or Snowflake, complete with full SQL access. This setup allows for transparency and customization, avoiding the limitations of rigid, pre-set reports. Like other dashboards, Saras Pulse integrates data with actionable insights, but its focus on infrastructure-level transparency sets it apart, enabling deeper, tailored analysis.
Metrics Tracked
The dashboard monitors a variety of metrics, covering retention (Repeat Purchase Rate, Churn Rate, Time Between Purchases, Retention Curves), financial performance (historical and predictive Customer Lifetime Value, LTV by Channel, Contribution Margin, CAC Payback), behavioral trends (RFM Scoring, Product Affinity, AOV), and operational factors (Subscription Churn, Fulfillment Issues).
What makes Saras Pulse stand out is its use of a "Semantic Layer", which applies certified data definitions. This ensures that teams across departments - whether in finance, marketing, or operations - calculate metrics like LTV and churn using consistent methods.
Real-Time Capabilities
Saras Pulse automates reporting for cohorts, LTV, and repeat purchases, with dashboards that update in real time. This allows teams to quickly identify churn trends, such as spikes after the second or third purchase, and immediately launch loyalty or win-back campaigns. Jordan Narducci, Head of eCommerce, highlights how this real-time insight transforms decision-making.
The platform also incorporates AI/ML models, delivering forecasts for growth, inventory, and revenue with about 95% accuracy. This predictive power enables businesses to plan ahead rather than react after trends emerge.
Data Sources
With over 200 connectors, Saras Pulse integrates seamlessly with platforms like Shopify, Amazon, Walmart, GA4, Klaviyo, Meta Ads, Google Ads, TikTok Shop, and Recharge. It also connects with omnichannel systems such as retail POS, ERPs, and CRMs. Additionally, it employs first-party, server-side tracking through Blotout's EdgeTag, ensuring precise multi-touch attribution for long-term LTV measurement.
Unique Strengths
In September 2024, the $220M apparel brand Faherty used Saras Pulse to shift from generalized RFM averages to more specific, cohort-driven insights. This change led to impressive results, including a $1.1M increase in incremental sales (+46% YoY), a 5% drop in circulation, a boost in incremental ROAS from 7.0 to 10.84, and 92% accuracy in sales forecasting.
Beyond technology, Saras Pulse offers support through a team of ecommerce data specialists who act as embedded analytics partners. Users report saving over 160 analyst hours per month thanks to automated reporting, as well as a 95% cut in Klaviyo data costs and a 75% reduction in annual data stack expenses. Pricing starts at $300 per month for the Growth Plan, with custom enterprise options based on data volume and scope. With a 4.8/5 rating on G2, users value its pre-built ecommerce data models combined with the flexibility to customize KPIs without needing a full in-house data team.
5. Klipfolio Customer Retention Dashboard
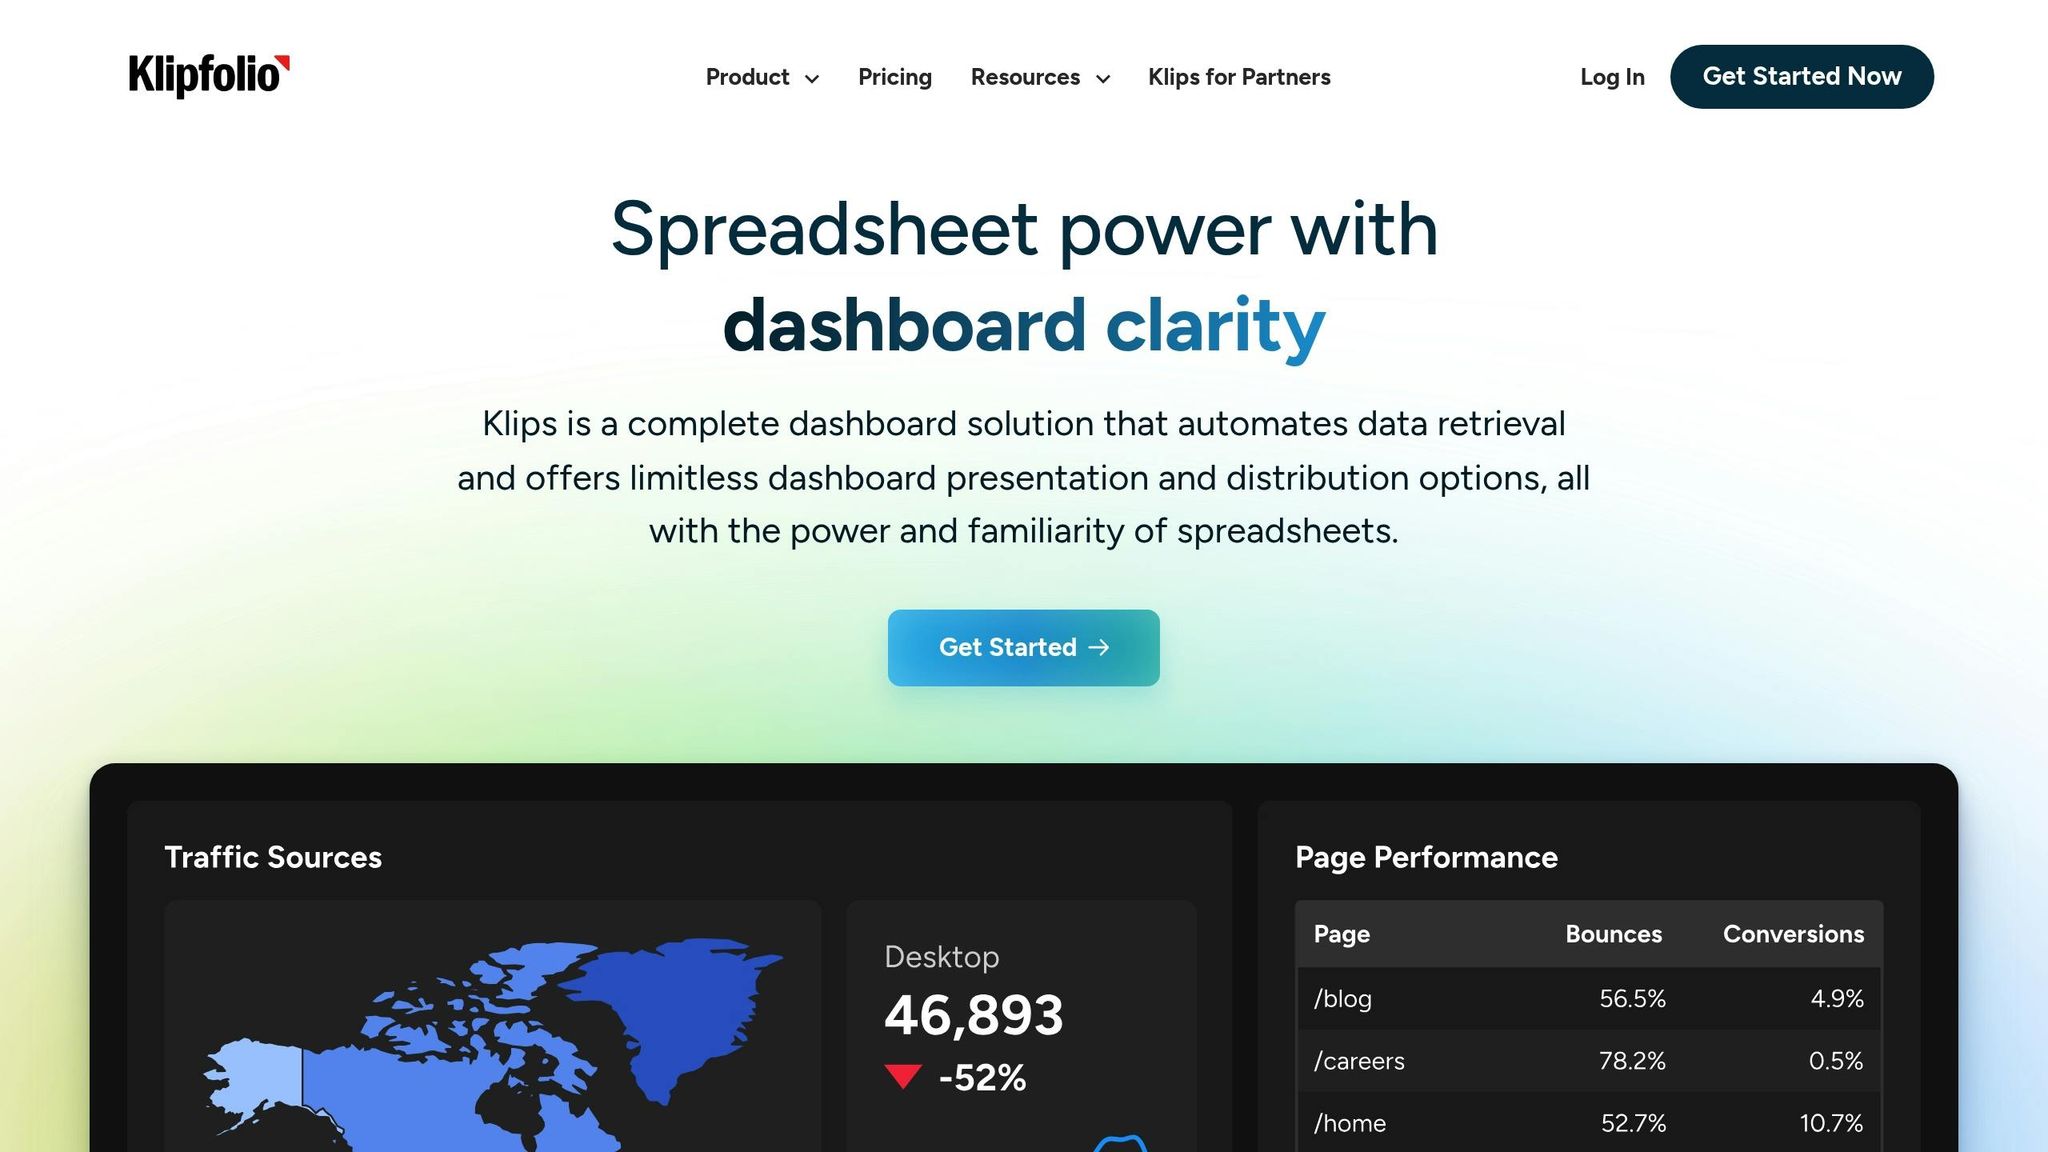
Klipfolio stands out as a tool designed to deliver quick, actionable insights, making it accessible not just for analysts but for teams across different departments. The dashboard is built around Marcus Taylor's "2/20/200 Rule", which emphasizes understanding a situation in 2 seconds, identifying causes in 20 seconds, and taking action within 200 seconds. This approach ensures that teams can act swiftly and effectively. With 6.7TB of data processed daily and over 100,000 users in 82 countries, Klipfolio has a global reach.
Metrics Tracked
Klipfolio tracks several key retention metrics that directly guide decision-making:
- Net Retention: Measures growth by comparing expansion to churn and reduction, aiming for over 100% monthly growth.
- Cancellations: Alerts teams to reach out and address customer issues.
- Contractions: Highlights customers downgrading, signaling areas for onboarding improvement.
- Expansions: Identifies opportunities for targeted campaigns based on upgrades or added features.
- Account Retention and Gross Retention: Tracks overall customer retention performance.
- Monthly Recurring Revenue (MRR): Monitors revenue trends to assess business health.
Each of these metrics is designed to prompt specific actions, from improving customer success strategies to refining onboarding processes.
Real-Time Capabilities
One of Klipfolio's defining features is its ability to update data in real time, with refresh rates ranging from every minute to every 24 hours. This shift from static, end-of-month reports to live data allows teams to respond immediately to potential issues. For example, cancellations can be flagged and addressed within minutes, helping to prevent broader trends from developing.
As Travis Baxter, Senior Manager of Analytics, puts it:
With Klipfolio, our real-time data is up on a central screen for everyone to see. It's drastically cut down questions to our analytics team so they can focus on actual analysis.
The platform also offers a "TV mode" for wallboards, ensuring that retention metrics are visible to all departments and remain a priority.
Data Sources
Klipfolio integrates with over 130 prebuilt connectors, making it easy to pull data from tools like Salesforce, Stripe, Zuora, HubSpot, Google Analytics, and Pipedrive. It also connects to SQL databases, FTP servers, and APIs, allowing seamless consolidation of data from multiple sources. This eliminates the need for manual spreadsheet work, streamlining the process of calculating retention metrics.
Robin Prinsen, CEO of a Klipfolio client, highlights the impact:
Since implementing Klips, we're saving roughly two hours a week per client on reporting. Dashboards have helped us stay on top of our internal data and client performance, resulting in a much higher client retention rate.
Unique Strengths
Klipfolio starts at $120/month (USD) and offers a free 14-day trial. For teams without dedicated data engineers, the platform includes an Excel-like formula editor to handle complex calculations with ease. Additionally, it provides flexible sharing options, such as secure links, public URLs, mobile web access, and scheduled emails, ensuring that critical data reaches the right stakeholders.
It's worth noting that improving retention by just 5% can increase profits by 25%–95%, underscoring the importance of tools like Klipfolio in driving business growth.
Advantages and Limitations
Real-time retention dashboards come with their own set of strengths and challenges, which vary depending on factors like team size, technical expertise, and specific business goals. Recognizing these differences helps ensure that the chosen tool aligns with actual needs, avoiding mismatches that could hinder success. Below is a breakdown of the most common advantages and limitations, along with a summary table for easy reference.
Template-based platforms such as Amplitude excel at behavioral analysis, helping teams uncover critical usage patterns without needing custom queries. Its free starter tier supports up to 50,000 monthly tracked users, making it accessible for smaller or growing SaaS companies. However, Amplitude's value depends heavily on proper setup and clean event tracking. Teams without technical expertise may find the learning curve challenging.
Ease-of-use tools like TelemetryDeck simplify data collection through SDK updates. This eliminates the need for manual setup but comes at the cost of limited customization for more advanced retention models. Klipfolio, on the other hand, starts at $120/month and supports a range of analytics needs. However, since it isn’t specifically designed for retention, users must manually configure metrics like lifetime value (LTV) and churn, which can be time-consuming.
Specialized platforms such as ChurnZero and Gainsight provide advanced features like predictive health scores. These tools combine behavioral, support, and billing data to identify at-risk accounts 30–90 days before they churn. While highly effective, these platforms require significant investment, ongoing technical support, and a steady flow of data, which can overwhelm teams if not managed carefully.
A recurring challenge with retention dashboards is the "analytics-to-action gap." This happens when metrics are tracked but not acted upon in a timely manner, turning dashboards into expensive reporting tools rather than effective churn-prevention solutions. As Alex Boyd from ChurnZap puts it:
Analytics tell you who's leaving. Automated retention gets them to stay.
Another issue is that real-time data is often raw and unprocessed. Spikes in activity might result from errors rather than actual performance changes. Without robust validation processes, businesses risk making reactive decisions based on inaccurate data. The choice of dashboard plays a crucial role in determining how quickly and effectively a company can act on retention insights.
Summary Comparison of Dashboards:
| Dashboard | Best For | Key Advantage | Main Limitation |
|---|---|---|---|
| Amplitude | Product & growth teams | Behavioral analysis with free starter tier | Steep learning curve; requires clean event tracking |
| TelemetryDeck | Teams needing quick setup | Automatic data collection with no extra code | Limited customization for complex models |
| Klipfolio | SMBs & agencies | Starts at $120/month | Not purpose-built for retention; manual configuration for LTV and churn metrics required |
| ChurnZero/Gainsight | Enterprise churn prevention | Predictive modeling 30–90 days ahead | High cost; requires ongoing technical maintenance |
| Saras Pulse | Omnichannel ecommerce | Auto-scaling with unified data models | Requires alignment across teams on metric definitions |
Conclusion
The dashboards discussed above provide tailored solutions to meet various business retention needs. Selecting the right real-time retention dashboard comes down to your business's size and technical capabilities. For small to mid-sized teams, Excelmatic offers a no-code interface that simplifies data handling, while Klipfolio stands out with its $120/month entry point and its 2/20/200 Rule, which ensures actionable insights across departments. If you're looking for fast deployment with minimal IT involvement, monday.com delivers automated alerts and a quick 2–4 week implementation timeline.
For growth-stage companies, Bloomreach combines analytics and campaign execution, producing impressive outcomes like a 380% increase in CRM revenue for clients such as Arriva UK Bus. On the enterprise side, Saras Pulse excels at managing complex omnichannel data with predictive analytics boasting 95% accuracy. Its cohort-driven insights have driven results like Faherty’s $1.1M boost in incremental sales and 92% forecasting accuracy.
Each platform tackles retention challenges in unique ways: Excelmatic simplifies data conversion with AI assistance, monday.com uses sentiment analysis to guide decision-making, Bloomreach processes data in under 100 milliseconds, Saras Pulse ensures metric consistency with its semantic layer, and Klipfolio provides real-time visibility through its wallboard feature. These tools turn retention data into actionable strategies, helping teams address churn proactively.
For more information on real-time analytics tools, check out the Marketing Analytics Tools Directory.
FAQs
What retention metrics should I track first?
To get started, focus on tracking your retention rate - this tells you what percentage of customers stick around and keep using your product or service over time. Keep an eye on the churn rate as well, which highlights how many customers you're losing. Another key metric is Customer Lifetime Value (CLV), which helps you understand the long-term profitability of your customer base. These core metrics give you a solid starting point for assessing loyalty and engagement before diving deeper into things like cohort trends or customer behavior patterns.
How do I connect my data sources for real-time retention?
To link data sources for real-time retention, opt for platforms designed to handle real-time event ingestion and syncing. These tools allow you to process events as they happen and push updates directly to their destinations. The process generally includes enabling real-time syncing, configuring event flows, and ensuring your data source streams information to platforms equipped for immediate updates.
How can I turn retention insights into churn-prevention actions?
To tackle customer churn effectively, start by diving into real-time dashboards. These tools can reveal early warning signs, like drops in engagement or spikes in churn rates. Once you spot these patterns, use the insights to take action - whether that's crafting personalized offers or sending tailored messages to re-engage users.
You can also leverage predictive analytics to pinpoint customers who might be at risk of leaving. With this information, you can act proactively by offering customized surveys, exclusive discounts, or other retention strategies. These steps not only help reduce churn but also build stronger, long-term relationships with your customers.