Real-time video campaign monitoring lets you adjust your video marketing campaigns while they’re live, ensuring better performance and ROI. Instead of waiting for delayed reports, you can access data within seconds to identify issues, tweak strategies, and maximize results. Here’s what you’ll learn:
- Why it matters: 46% of marketers review reports weekly, but real-time insights let you respond instantly to underperforming ads or audience drop-offs.
- Key metrics to track: Watch time, audience retention, click-through rates (CTR), engagement, and conversion rates are crucial for optimizing campaigns.
- Top real-time analytics tools: Platforms like Wistia, Vidyard, and Google Analytics 4 provide real-time dashboards, heatmaps, and integration with CRM systems.
- Advanced strategies: Use AI-driven automation, A/B testing, and sentiment analysis to refine creative elements and scale campaigns effectively.
Takeaway: Real-time monitoring is no longer optional - it’s a must-have for staying competitive in fast-paced digital marketing. With the right tools and strategies, you can make data-driven decisions that boost engagement and revenue while campaigns are still active.
How To ACTUALLY Measure Your Video ROI!
sbb-itb-5174ba0
Why Real-Time Monitoring Matters for Video Campaigns
When it comes to video campaigns, timing is everything. The gap between success and failure often hinges on how quickly you can respond to issues. Relying on weekly or monthly reports can leave you playing catch-up. By the time you spot problems like underperforming ads or budget mismanagement, the damage is already done. Here's a telling stat: 46% of marketers review their reports weekly, while 25% only check monthly. In today's fast-paced marketing world, that's just not quick enough.
Benefits of Real-Time Video Monitoring
Real-time monitoring gives you the power to take control of your campaigns as they unfold. Instead of waiting days or weeks to find out that your ad spend is missing the mark, you can make adjustments - like reallocating budgets, tweaking bids, or changing creative elements - within hours.
Take Gordian's five-video campaign as an example. By leveraging Vidyard analytics alongside Marketo and Salesforce, the company identified high-intent leads in real time, resulting in $6 million in attributed revenue. Glenn Hughes, Gordian's former Video Producer, highlighted the impact:
It proved that strategic planning and detailed video analytics can generate a tremendous return on investment for the organization.
This kind of success isn't just about analyzing numbers; it's about acting on them immediately. Real-time data doesn't just protect your ad spend - it also uncovers valuable insights into viewer behavior. For instance, repeat engagement, like viewers re-watching key sections or multiple videos, signals strong interest. Your sales team can jump on these leads while the interest is still fresh. Compare that to traditional reporting, which might miss these nuances entirely.
And here's another critical point: 20% of viewers will click away within 10 seconds. If your hook isn't working, you'll know instantly with real-time marketing analytics tools, giving you the chance to pivot before you lose even more of your audience.
Risks of Ignoring Real-Time Monitoring
The consequences of skipping real-time monitoring can be costly. Linda Grönlund of Supermetrics cautions that infrequent reviews delay your ability to respond to issues like declining conversions or overspending on clicks.
One major pitfall is falling for vanity metrics. A video might rack up millions of views, but if those views aren't coming from your target audience or aren't leading to meaningful engagement, the numbers are worthless. Without real-time insights, you could be celebrating high view counts while your conversion rates quietly tank.
Another risk is algorithm disruption. Platforms like Google and Meta rely on learning phases to optimize ad delivery. If you’re not monitoring in real time, you might disrupt the algorithm by making changes too soon - or you might wait too long, letting poor performance drag on. Either way, you're burning money and losing efficiency. Real-time data helps you strike the perfect balance, knowing when to step in and when to let the algorithm do its job.
And then there’s the competitive angle. During peak seasons or trending moments, your competitors are likely monitoring and optimizing their campaigns by the hour. If you're stuck waiting for a weekly report, you could already be falling behind. This is especially critical when you consider that mobile devices account for 70% of YouTube watch time. If your video isn't optimized for mobile and you're slow to react, you're missing out on a massive chunk of your audience.
Real-time monitoring isn't just a tool - it's a necessity for staying agile and competitive in the fast-moving world of video marketing.
Key Metrics to Track for Real-Time Video Campaigns
Real-Time Video Metrics Comparison Across Major Platforms
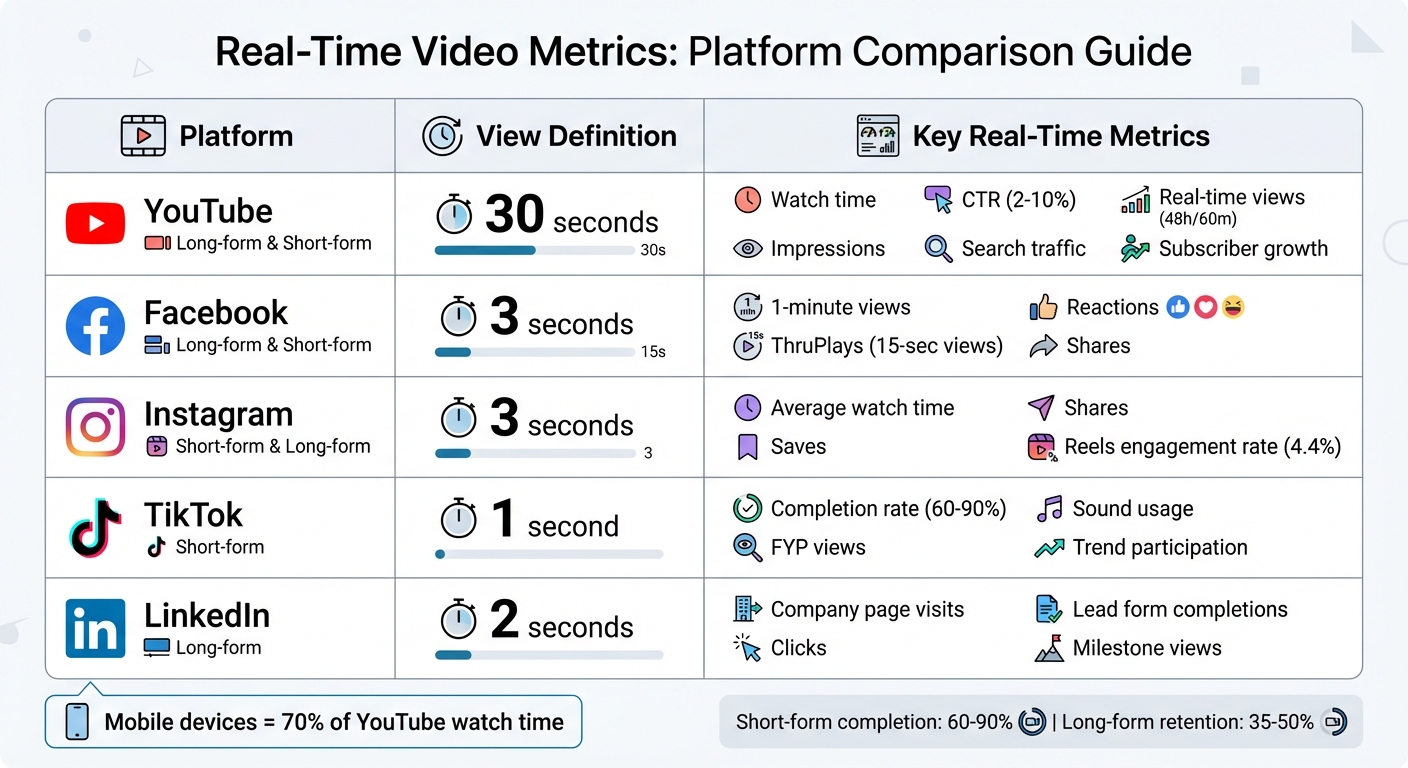
Not all platforms define a "view" the same way. For instance, YouTube counts a view after 30 seconds, TikTok after just 1 second, and Facebook/Instagram after 3 seconds. Because of these variations, understanding and tracking the right metrics and comparing campaign tracking tools is essential to optimize your video campaigns. Let’s break it down into universal and platform-specific metrics.
Core Real-Time Metrics
When you're aiming for immediate insights, these metrics are the foundation of a successful campaign.
Watch time is a standout metric, especially on YouTube. It represents the total time viewers spend watching your content. As Derral Eves, Founder of VidSummit, explains:
Watch time is the currency of YouTube. The longer you keep people watching, the more YouTube will push your content.
This directly impacts how algorithms rank and promote your videos, making it a critical focus for creators.
Audience retention shows where viewers lose interest by mapping drop-off points. For short-form videos, completion rates often range from 60–90%, while longer videos typically see 35–50% retention. This insight helps pinpoint areas where engagement might be slipping.
Click-through rate (CTR) measures how effective your thumbnail and title are at drawing viewers in. YouTube CTRs usually range from 2% to 10%. A low CTR can indicate that even high-quality content is being overlooked. As Matt Koval, former Creator Liaison at YouTube, notes:
YouTube's search and discovery system loves videos that people have found satisfying, and a great way it determines that is audience retention.
Engagement rate tracks likes, comments, shares, and saves. These interactions are key indicators of how well your content resonates. Adam Mosseri, Head of Instagram, emphasizes:
Engagement rates are more important than follower counts... reshares are one of the biggest signals we use in ranking.
For example, Instagram Reels average about a 4.4% engagement rate, while YouTube Shorts hover around 3.8%.
Conversion rate focuses on whether viewers take the desired action after watching your video, such as signing up, purchasing, or downloading. Videos on landing pages can increase conversions by up to 80%, making this metric vital for campaigns with clear calls to action.
Platform-Specific Metrics
Each platform brings its own set of metrics, requiring tailored approaches to maximize success.
- YouTube: Prioritizes metrics like impressions, search traffic, and subscriber growth, making it ideal for long-form, educational content.
- Facebook and Instagram: Tracks 3-second views and "ThruPlays" (15-second views or full completions), offering a clearer picture of active engagement versus casual scrolling.
- TikTok: Focuses on "For You" page (FYP) views, sound usage, and trend participation, which are key to achieving viral momentum.
- LinkedIn: Highlights professional engagement through company page visits and lead generation form completions.
| Platform | View Definition | Key Real-Time Metrics |
|---|---|---|
| YouTube | 30 seconds | Watch time, CTR, Real-time views (48h/60m) |
| 3 seconds | 1-minute views, Reactions, Shares | |
| 3 seconds | Average watch time, Saves, Shares | |
| TikTok | 1 second | Completion rate, FYP views, Sound usage |
| 2 seconds | Company page visits, Clicks, Milestone views |
To succeed on each platform, align your strategy with its unique strengths. For TikTok, focus on creating content that encourages looping and utilizes trending sounds. On LinkedIn, provide value-driven content that motivates professional engagement and lead form completions. Matching your campaign goals to each platform’s metrics is the key to success.
Top Tools for Real-Time Video Campaign Monitoring
When it comes to optimizing video campaigns on the fly, having the right tools makes all the difference. The best platform for your needs depends on your campaign goals. For example, if you're focused on lead generation and sales tracking, tools like Wistia and Vidyard shine by linking video engagement directly to revenue. For live streaming and broadcast quality, Watchity provides real-time technical performance insights. And for cross-channel analytics, Google Analytics 4 (GA4) integrates video data into your broader marketing metrics.
M. Tre Gonzalez, Director of Growth at OnCourse Systems for Education, highlights the power of these tools:
Wistia's analytics give us deep insights into our customer journey... we get a big-picture view of which videos engage prospects and a detailed look at how they interact with each video, down to the specific sections they rewind or skip.
Standout Features of Key Tools
- Wistia: Known for its second-by-second heatmaps, Wistia reveals exactly where viewers engage or drop off. It also sends real-time sales alerts when viewers hit milestones, like watching 75% of a demo video.
- Watchity: Focuses on Quality of Experience (QoE) metrics, such as buffering rates and resolution changes, making it ideal for live events.
- api.video: Tracks real-time viewer activity segmented by location, browser, and device as interactions happen.
- Google Analytics 4: Offers milestone tracking (e.g., 25%, 50%, 75%, and 100% completion) and connects video performance to overall website metrics.
Tool Comparison
| Tool | Key Real-Time Features | Primary Use Case | Supported Integrations |
|---|---|---|---|
| Wistia | Heatmaps, A/B testing, engagement tracking | Lead generation and sales focus | HubSpot, Pardot, GA4, Marketo |
| Watchity | QoE metrics (buffering, resolution) | Live streaming and broadcasts | NPAW solution |
| api.video | Geo/device segmentation, real-time tracking | Developer-friendly video delivery | Analytics SDKs |
| Google Analytics 4 | Milestone tracking, conversion insights | Cross-channel performance | Wistia, Google Ads |
Pricing options vary. Wistia offers tiered plans, including a free version for up to 10 videos, while Vidyard provides a free tier for hosting up to 25 videos. Watchity, on the other hand, offers custom pricing for its advanced analytics [21, 23, 28].
Integrating Tools with Campaign Platforms
Once you've chosen a tool, integrating it with your existing platforms ensures you capture every meaningful interaction. Most tools offer native connectors or can be set up using Google Tag Manager (GTM). For instance:
- Wistia and Vidyard: Seamlessly integrate with GA4, HubSpot, and Salesforce to automatically log video events like plays, watch progress, and CTA clicks [21, 7].
- YouTube with GA4: GA4's Enhanced Measurement feature tracks video interactions (start, progress at 10/25/50/75%, and completion) without extra setup. To enable it, go to Admin > Data Streams > Web Stream > Events and toggle "Video engagement".
- Vimeo or Wistia with GTM: Configure GTM to send custom events like
video_titleandvideo_percentto GA4 for deeper insights.
For CRM and Marketing Automation Platform (MAP) syncing, connecting tools like Marketo or Pardot with video platforms can enhance lead scoring and trigger workflows. For example, sales teams can receive alerts when high-value prospects watch key videos or hit specific watch-time thresholds [19, 7].
JW Player adds another layer of real-time analytics, showing active viewers, locations, and top-performing content within a two-minute window. While GA4 tracks standard milestones like 10%, 25%, and 50%, GTM lets you monitor more detailed points, such as 90%, which often signals true completion.
For a deeper dive into available solutions, the Marketing Analytics Tools Directory is a great resource. It allows businesses to compare tools based on real-time analytics, campaign tracking, and integration capabilities, helping you find the best fit for your needs and tech stack.
Setting Up Real-Time Monitoring Dashboards
Before diving into dashboard creation, it's essential to define what success looks like for your campaigns. Are you aiming to boost conversions, improve ROAS, or generate top-of-funnel leads? This clarity will guide you in selecting the right metrics to track - like concurrent viewers, click-through rates, or buffer rates - so you can monitor performance in real time. A well-designed dashboard not only organizes this data but also empowers you to act quickly based on viewer behavior.
Dashboard Configuration Steps
The first step is to centralize all your video and ad data. Connect platforms such as YouTube, Meta, and Google Ads into one data warehouse or repository. This unified setup eliminates the hassle of switching between tools. To make cross-platform comparisons meaningful, ensure you standardize naming conventions for campaigns, ad sets, and conversion events.
Once your data is centralized, apply filters and segmentations. Break down data by device, browser, operating system, and geography to uncover trends - like identifying if iOS users are dropping off faster than Android users. Next, set up thresholds and alerts. Use either custom or AI-driven performance benchmarks, and incorporate color-coded indicators to flag anomalies instantly.
Linda Grönlund, Performance and Growth Marketing Manager at Supermetrics, highlights the importance of real-time data:
Real-time ad analytics shows what's happening in your campaigns as it happens. With timely data, you can adjust bids, shift budgets, and improve creative in hours rather than waiting for the next reporting cycle.
To stay on top of changes, automate notifications. Integrate your dashboard with tools like Slack, Microsoft Teams, or email to receive alerts when spending exceeds limits or performance metrics drop. Finally, determine how frequently your dashboard should refresh. While most real-time dashboards update every 5 to 30 seconds, leading platforms often offer a 20-second refresh rate with less than 30 seconds of latency. This setup ensures you have a fast, consolidated view for managing campaigns across multiple platforms.
Multi-Channel Dashboard Setup
For campaigns that span multiple platforms, a multi-channel dashboard provides a holistic view of performance. By integrating data from social platforms, websites, and even CRM or Marketing Automation Platforms, you can track everything in one place. Use UTM parameters on all video links to accurately attribute traffic and conversions. Also, given that 85% of Facebook videos are watched without sound, it’s worth separately analyzing engagement metrics for videos with and without captions.
Advanced tools take this a step further, offering up to 20 filters and 200 monitored dimension values per dashboard. This level of detail allows you to monitor key variables like live versus VOD performance, CDN differences, ISP variations, and device-specific trends - all critical for optimizing campaigns. If you're unsure which tool fits your needs, the Marketing Analytics Tools Directory can help you compare options based on real-time analytics capabilities and integration features, ensuring you find a solution that works seamlessly with your existing tech stack.
Advanced Strategies for Optimizing Video Campaigns
Building on earlier discussions about dashboard setup, these strategies use real-time data to fine-tune campaigns on the fly. By leveraging tools like AI-driven automation, A/B testing, and sentiment analysis, you can respond to viewer behavior in hours instead of days. This means maximizing ROI and scaling successful tactics before losing momentum.
AI-Driven Automation
AI tools, such as Voluum Automizer, simplify routine tasks by optimizing performance in real time. These platforms use rule-based actions to adjust bids, allocate traffic, and detect fraud without manual input. For instance, Voluum's AI engine can instantly block bot traffic using fraud detection features.
"Voluum gave us the opportunity to skip endless, routine reporting jobs and optimize our campaigns easily with real-time reporting and API integration".
Real-Time Bidding (RTB) also benefits from AI, with auctions happening in under 300 milliseconds. Algorithms assess bids against targeting criteria and set inventory prices programmatically.
"Real-time data is essential [in RTB], as it allows you to assess bids against targeting criteria and set prices promptly".
To prevent overcorrections during algorithm learning phases, set predefined thresholds for metrics like CPA or CTR. AI-powered video analytics bring even more precision, enabling advanced features like object detection and scene analysis.
An example of AI's potential: Harley Davidson used Albert.ai to customize and optimize ads across platforms like Facebook and YouTube, achieving a staggering 2,930% increase in monthly leads. Predictive analysis further boosts results by using historical data to forecast trends, helping you align content with anticipated viewer behavior before campaigns even launch.
While AI handles routine tweaks, controlled testing sharpens creative elements.
A/B Testing and Sentiment Analysis
Real-time A/B testing accelerates decision-making by acting as soon as experiments reach 70-80% confidence levels. This is ideal for testing elements like thumbnails, titles, call-to-action buttons, video length, and messaging.
Sentiment analysis dives deeper than basic metrics, examining unprompted consumer opinions to uncover the reasons behind audience behavior. Tools like Brand24 and Brandwatch provide real-time sentiment tracking, and companies using social listening report 2.4× higher customer retention rates. Configure alerts for negative sentiment spikes (e.g., mentions exceeding 40% negativity) to address issues quickly. With 68% of consumers expecting brands to respond to social media complaints within three hours, this kind of monitoring is vital for maintaining a strong brand reputation.
Heatmaps offer second-by-second insights into viewer behavior, showing where people pause, skip, or rewatch content. AI tools can also evaluate video ads within 72 hours of launch to ensure they follow best practices, such as clear brand logos, effective text overlays, and optimal durations. If play rates are low, try testing a custom thumbnail featuring a mid-profile or action shot to grab attention.
Once these optimizations show results, you can scale your efforts using real-time insights.
Scaling Campaigns with Real-Time Insights
Centralizing data from all channels allows for standardized performance comparisons. Real-time insights enable dynamic adjustments, like shifting budgets or modifying bids, within hours instead of waiting for weekly or monthly reports. Consider using color-coded dashboards for quick visual cues: underperforming metrics in red and targets met in green make it easier to spot budget issues or performance dips.
For instance, Skoda increased the average time visitors spent on their website from under one minute to 20 minutes during live events using Onlive.Site analytics. Meanwhile, Saigu Cosmetics achieved a 14% conversion rate through interactive, shoppable videos. By analyzing re-watch patterns, you can identify high-performing segments and create more focused content for future campaigns. With mobile devices accounting for about 70% of YouTube watch time, ensure that AI-driven creative tools emphasize clear visuals and readable text for smaller screens.
Set thresholds for metrics like CPA or CTR to avoid overcorrections while allowing algorithms to stabilize. Automated alerts through Slack, Microsoft Teams, or email can notify you of significant cost spikes or CTR drops, enabling quick adjustments before budgets are wasted.
If you're looking for the right tools to scale your campaigns, check out the Marketing Analytics Tools Directory. It provides a comprehensive list of platforms for real-time analytics, A/B testing, and campaign tracking, helping you find the best fit for your needs.
Conclusion and Next Steps
To wrap things up, let’s focus on how to take action based on the strategies outlined earlier. Real-time video campaign monitoring isn’t just a nice-to-have anymore - it’s essential if you want to stay ahead. The ability to quickly spot what’s working and what’s not can make or break your campaign. Metrics like play rate, engagement rate, and completion rate allow you to make decisions in hours instead of waiting weeks.
Before you launch your next video, start by setting clear goals. Are you aiming to boost brand awareness, generate leads, or close sales? The answer will guide which metrics deserve your attention. Kristen Ewen, Director of SEO at Property Manager Websites, offers some wise advice here:
Perfection is the killer of productivity. Do your best to get it right but do not get hung up on perfect. Be prepared to track, monitor and adjust as needed.
Once your objectives are in place, focus on metrics that drive results. Use real-time dashboards with color-coded alerts to keep an eye on critical thresholds. Don’t forget to optimize for mobile - after all, 70% of YouTube watch time happens on mobile devices. And when heatmaps reveal where viewers are dropping off, address those problem areas immediately. Waiting until the next campaign cycle to make changes could cost you valuable opportunities.
Key Takeaways
The formula for success is pretty straightforward: define your KPIs, leverage the right tools, and monitor critical metrics in real time. Play, engagement, and conversion rates are the big ones to watch. For example, videos that perform well usually maintain a completion rate of at least 60%. If yours doesn’t, use heatmaps to pinpoint where viewers lose interest and adjust accordingly.
Let AI-driven tools handle repetitive tasks like routine optimizations, while A/B testing fine-tunes your creative assets. Sentiment analysis can also provide deeper insights into audience behavior, helping you protect your brand’s reputation and improve ROI.
Using the Marketing Analytics Tools Directory
Choosing the right tools can feel overwhelming, especially when so many platforms seem to offer similar features. That’s where the Marketing Analytics Tools Directory comes in handy. It organizes top analytics platforms into categories like real-time analytics, campaign tracking, and A/B testing, making it easier to find exactly what you need.
Start by identifying your primary goal. Whether it’s increasing CTR, growing your email list, or maximizing ROI, knowing your focus will help you narrow down your options. Look for tools that offer real-time dashboards, seamless CRM integration with platforms like Salesforce or HubSpot, and detailed heatmaps that track viewer behavior second by second. The directory also includes pricing details and feature comparisons, so you can quickly find a solution that fits both your needs and your budget.
FAQs
How do I choose the right real-time KPIs for my video campaign goal?
First, pinpoint your main marketing goal - whether it's boosting brand awareness, driving engagement, or increasing conversions. Once that's clear, choose KPIs that directly reflect progress toward that goal.
For instance:
- If you're aiming for brand awareness, focus on metrics like views and impressions.
- For engagement, track watch time and click-through rates (CTR).
Using real-time tracking tools is essential. They let you monitor these metrics as your campaign runs, helping you make timely adjustments to stay on course and achieve your objectives.
How can I standardize “views” and retention across platforms?
To make “views” and retention metrics consistent across platforms, it’s important to create a shared framework that aligns with platform-specific definitions. For instance, what counts as a “view” on YouTube isn’t the same as on TikTok. Instead of relying solely on platform-defined views, focus on metrics that are easier to compare, like the percentage of a video watched or the average watch time.
Leveraging consolidated reports from resources such as the Marketing Analytics Tools Directory can simplify cross-platform analysis. These tools ensure you’re working with consistent data, helping you uncover actionable insights into how your audience engages with content.
What alert thresholds should I set to avoid over-optimizing?
Set alert thresholds with care to avoid unnecessary reactions and minimize false alarms. Base these thresholds on historical data to ensure they align with realistic patterns. Allow for some natural variability before triggering alerts - this helps you stay focused on meaningful changes rather than minor fluctuations.