Statistical significance calculators are essential for analyzing A/B testing results. They help determine if observed differences in conversion rates are due to real changes or random chance. These tools simplify complex calculations, offering outputs like p-values, confidence intervals, and lift to guide decision-making. Whether you're optimizing a website, testing email campaigns, or analyzing product pages, these calculators save time and provide actionable insights.
Here are the top 7 calculators for A/B testing:
- VWO A/B Test Significance Calculator: Designed for two-variant tests, it provides p-values, confidence intervals, z-scores, and color-coded results for easy interpretation.
- SurveyMonkey A/B Testing Significance Calculator: Focuses on simple two-variant tests with user-friendly visuals and sample size recommendations.
- CXL A/B Test Calculator: Ideal for multi-variant testing, offering detailed metrics like effect sizes and confidence intervals.
- Neil Patel A/B Testing Significance Calculator: Simplifies two-variant testing with practical insights on statistical and business relevance.
- Convertize Significance Calculator: Combines frequentist and Bayesian methods for efficient, clear results.
- Act-On Statistical Significance Calculator: A straightforward tool for quick p-value calculations and conversion lift analysis.
- ABTestGuide Significance Calculator: Offers both frequentist and Bayesian options with narrative summaries for better understanding.
Quick Comparison
| Calculator | Method | Test Variants | Key Outputs | Visualization Features |
|---|---|---|---|---|
| VWO | Frequentist | A/B | P-value, z-scores, confidence % | Color-coded results, plain summaries |
| SurveyMonkey | Frequentist | A/B | P-value, confidence level, sample size | Simple charts, text-based results |
| CXL | Frequentist | A/B, A/B/n | Confidence intervals, effect size | Detailed breakdowns, explanations |
| Neil Patel | Frequentist | A/B | P-value, confidence %, lift | Visual progress bars, summaries |
| Convertize | Hybrid | A/B | P-value, uplift, confidence % | Interactive charts |
| Act-On | Frequentist | A/B | P-value, lift, sample size | Basic table format |
| ABTestGuide | Frequentist & Bayesian | A/B | P-value, z-scores, decision probabilities | Narrative summaries, plain language |
These tools cater to different needs. For simple A/B tests, tools like Neil Patel and SurveyMonkey work well. For more complex setups, consider CXL or Convertize. Choose based on your testing goals and the level of detail required.
A/B Testing & Statistical Significance - 4 Steps to Know How to Call a Winning Test
1. VWO A/B Test Significance Calculator

VWO's A/B test significance calculator is built to make analyzing test results quick and accurate. It breaks down complex statistical calculations into easy-to-understand insights, helping you identify meaningful differences in conversion rates without the hassle.
Methodology
The calculator uses a frequentist statistical approach, relying on established formulas to determine if the differences in conversion rates are statistically significant or just random noise.
Variants Supported
This tool is designed specifically for two-variant testing, which focuses on comparing a control version with one variation. Whether you're testing different headlines, button colors, or page layouts, this straightforward setup is ideal for scenarios where two options are enough to draw clear conclusions without the added complexity of multi-variant tests.
Key Outputs
The calculator provides several critical metrics:
- P-value: A p-value below 0.05 signals statistical significance.
- Confidence intervals: These give a range for estimated conversion rates.
- Z-scores: Higher absolute z-scores indicate stronger evidence for a difference.
- Confidence percentage: This translates the statistical results into an easy-to-grasp format, making it simpler to act on the findings.
These outputs are designed to help marketers quickly understand their test results and identify actionable next steps.
Visualization Aids
To make the data even clearer, the interface includes color-coded results. For example, statistically significant outcomes might appear in green, while inconclusive results are highlighted in red. These visual cues make it easy to spot key insights at a glance.
Additionally, the tool provides plain-language summaries of the statistical findings, ensuring that even team members without a background in data analysis can interpret the results. The combination of clear visuals and simple explanations makes decision-making faster and more efficient, keeping your A/B testing process smooth and effective.
2. SurveyMonkey A/B Testing Significance Calculator

SurveyMonkey's A/B testing significance calculator takes the guesswork out of statistical analysis, turning complex math into straightforward insights that marketing teams can act on right away.
How It Works
This tool is built on a frequentist statistical framework, which uses traditional hypothesis testing to determine the likelihood that observed differences are due to chance. By applying proven statistical formulas, it helps identify whether changes in performance metrics reflect real improvements or are just random variations. The design is tailored for simple two-variant tests, ensuring clarity and ease of use.
What It Supports
The calculator is designed for two-variant A/B tests, making it perfect for comparing things like email subject lines, landing page layouts, or call-to-action buttons. This straightforward structure ensures that results are easy to analyze and interpret.
Results You Get
Here’s what the tool provides:
- A statistical significance indicator based on a 95% confidence level
- Confidence levels to gauge reliability
- Side-by-side comparisons to identify the better-performing variant
- Sample size recommendations for more accurate future tests
The focus is on delivering clear, actionable insights without overwhelming users with technical jargon.
Easy-to-Understand Visuals
The interface includes user-friendly charts, graphs, and progress bars, all color-coded for quick interpretation. It also offers plain-English summaries that break down metrics like p-values and confidence intervals into insights anyone can understand. This makes it easier to share findings across teams and with stakeholders.
3. CXL A/B Test Calculator
The CXL A/B Test Calculator stands out for its ability to handle multi-variant (A/B/n) testing. It allows users to set the number of variants during the planning phase and even add more later using the "+ Add Variant" button. This feature makes it possible to test several design elements or messaging strategies within a single experiment. Unlike tools that focus solely on two-variant tests, CXL offers greater flexibility for more complex experiments.
"A multivariate test is the same as an A/B test, but with more than one variant tested against a control." - Georgi Georgiev, Managing owner of Web Focus and creator of Analytics-toolkit.com
4. Neil Patel A/B Testing Significance Calculator
Neil Patel's A/B Testing Significance Calculator is a go-to tool for marketers who want quick, no-fuss insights. It’s built for simplicity, delivering essential statistical results in a way that’s easy to grasp. Designed with digital marketers in mind, this tool helps users make informed decisions without getting bogged down in complex data.
Methodology
The calculator uses a frequentist statistical approach, relying on p-values and confidence intervals to assess whether the differences between test variants are statistically significant or just due to chance. This method is widely trusted for its reliability in determining significance.
Variants Supported
This tool focuses on straightforward two-variant comparisons, making it perfect for standard A/B tests. Whether you’re comparing two versions of a webpage, email, or ad, this calculator keeps things simple. Unlike tools like the CXL calculator, which handle more complex multi-variant tests, Neil Patel’s tool is tailored to the most common testing scenario: a control versus a single variation.
Key Outputs
The calculator delivers vital metrics such as p-values, confidence levels, and confidence intervals. It also highlights the potential range of conversion rate differences between the two variants.
What makes this tool stand out is its focus on practical significance in addition to statistical significance. Instead of just confirming whether results are statistically valid, it helps users determine if the observed lift is meaningful for their specific business objectives. This approach ensures that marketers don’t just see the numbers - they understand their real-world impact.
Visualization Aids
The results are presented using clear visual indicators and easy-to-digest summaries. Narrative explanations break down what the numbers mean, making it easier to connect the data to actionable insights.
Color-coded results simplify interpretation, showing whether a test has reached significance, is trending toward it, or requires more data. The tool also includes recommendation statements, offering guidance on what to do next - whether that’s implementing the winning variant or refining the test further.
Additionally, the calculator provides sample size recommendations for future tests. This feature helps marketers better plan their experiments, taking into account typical conversion rates and confidence level goals for more reliable outcomes.
sbb-itb-5174ba0
5. Convertize Significance Calculator

The Convertize Significance Calculator is powered by a "Hybrid Statistics Engine", which blends frequentist and Bayesian methods to provide fast and dependable insights. By combining these two statistical approaches, the tool ensures quicker analysis while maintaining the reliability of traditional testing and the adaptability of Bayesian analysis. This combination makes it a practical choice for delivering focused and precise test results.
Variants Supported
Convertize is specifically designed for standard A/B testing scenarios, concentrating on two-variant comparisons. This means it evaluates a control (Variation A) against a single alternative (Variation B). By keeping the focus on this common testing setup, the tool simplifies the interface and streamlines the analysis process.
Key Outputs
The calculator provides four critical metrics for analyzing A/B tests:
- Conversion rates for both variations.
- Uplift, which shows the percentage change between the two variations.
- P-value, indicating the probability that the results occurred by chance.
- Overall test significance, typically expressed as a confidence level (e.g., 95% confidence means the observed results would occur by chance only once in 20 tests).
To keep the analysis user-friendly, the tool avoids more advanced outputs like z-scores or detailed confidence intervals.
Visualization Aids
The interface is intentionally simple, featuring input fields for traffic and conversions, a confidence level setting, and a calculate button. Results are displayed as clear numerical outputs without intricate visualizations. While this straightforward design appeals to users seeking direct data, some basic statistical knowledge may be needed to interpret the results effectively.
6. Act-On Statistical Significance Calculator

The Act-On Statistical Significance Calculator simplifies hypothesis testing by calculating the p-value. This helps determine if the differences observed in your A/B test results are real or just random chance. It's a handy tool for making fast, informed decisions based on your test data.
7. ABTestGuide Significance Calculator
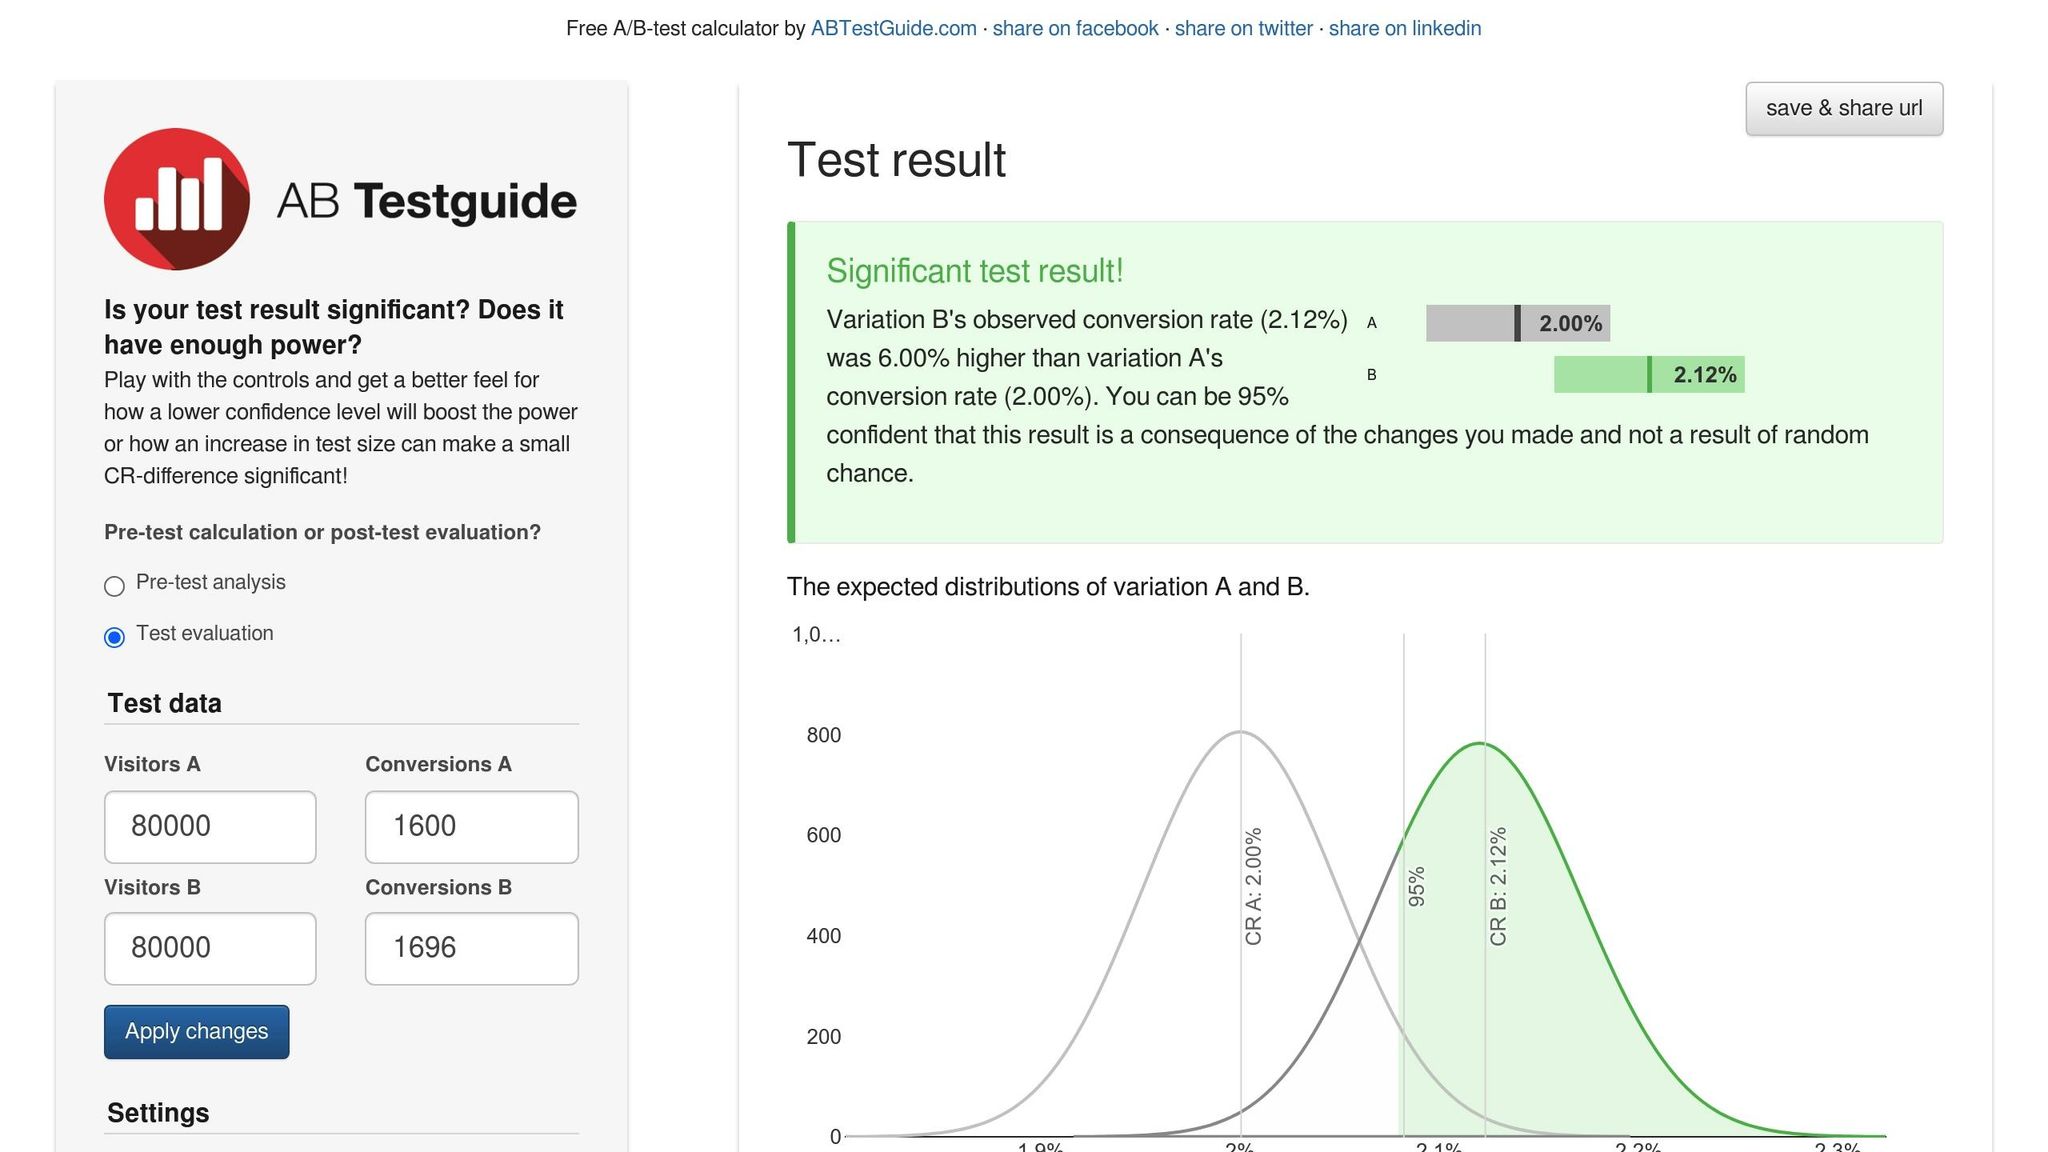
ABTestGuide offers two distinct calculators for A/B testing: one built on traditional frequentist methods and another using Bayesian decision probabilities. The frequentist calculator provides key statistics like the p-value, Z-score, and Observed Power. On the other hand, the Bayesian A/B-test Calculator focuses on decision probabilities, such as the likelihood of B outperforming A or A outperforming B. This dual setup lets users choose the statistical approach that best fits their specific testing goals. Both tools are designed with user-friendly visuals to simplify interpretation.
Visualization Aids
To make the data more accessible, ABTestGuide includes narrative summaries that break down the numbers into straightforward insights. For instance, the calculator might explain:
"You can be 95% confident that this result is a consequence of the changes you made and not a result of random chance"
This type of explanation ensures even those without a statistical background can grasp the key takeaways from their test results.
Calculator Comparison Table
Selecting the right statistical significance calculator depends on your testing goals and the level of detail you require. The seven tools listed below cater to different needs, offering unique features and benefits.
| Calculator | Statistical Method | Test Variants | Key Outputs | Visualization Features |
|---|---|---|---|---|
| VWO A/B Test Significance Calculator | Frequentist | A/B, A/B/n (multivariate) | Statistical significance, confidence intervals, conversion rates | Clean interface with color-coded results |
| SurveyMonkey A/B Testing Significance Calculator | Frequentist | A/B only | P-value, confidence level, sample size recommendations | Simple text-based results display |
| CXL A/B Test Calculator | Frequentist | A/B, A/B/n (multivariate) | Statistical significance, confidence intervals, effect size | Detailed statistical breakdown with explanatory text |
| Neil Patel A/B Testing Significance Calculator | Frequentist | A/B only | Win probability, confidence level, statistical significance | Visual progress bars and percentage displays |
| Convertize Significance Calculator | Frequentist | A/B, A/B/n (multivariate) | P-value, Z-score, confidence intervals | Interactive charts and graphs |
| Act-On Statistical Significance Calculator | Frequentist | A/B only | Statistical significance, conversion lift, sample size | Basic tabular results format |
| ABTestGuide Significance Calculator | Frequentist & Bayesian | A/B only | P-value, Z-score, Observed Power, decision probabilities | Narrative summaries with plain-language explanations |
This table provides a snapshot of each calculator, but digging deeper reveals key differences. Most calculators rely on frequentist methods, but ABTestGuide offers both frequentist and Bayesian approaches, giving users flexibility in their statistical framework.
Test variant support also varies. Tools like SurveyMonkey, Neil Patel, Act-On, and ABTestGuide focus on simple A/B tests, while VWO, CXL, and Convertize handle more complex multivariate scenarios (A/B/n). The level of detail in outputs differs too - basic calculators provide core metrics, while tools like CXL and ABTestGuide include advanced statistics, such as Z-scores, effect sizes, and observed power.
Visualization styles range from straightforward text displays to more dynamic formats. ABTestGuide simplifies complex data with narrative explanations, Convertize uses interactive charts, and Neil Patel emphasizes visual progress bars for clarity.
If you're just starting with A/B testing, SurveyMonkey and Neil Patel offer user-friendly interfaces and minimal statistical jargon. For those needing deeper insights, CXL and ABTestGuide provide more advanced options. For simple A/B tests, SurveyMonkey, Neil Patel, Act-On, and ABTestGuide are excellent choices. However, if you’re tackling multivariate testing, VWO, CXL, and Convertize are better suited to handle the complexity.
Match your testing needs to the calculator that aligns with your goals for the best results.
Conclusion
Each A/B testing calculator serves a distinct purpose, tailored to different needs:
- VWO is ideal for teams tackling complex multivariate tests, thanks to its intuitive interface and detailed outputs.
- SurveyMonkey simplifies the process for beginners, offering quick and straightforward calculations without diving into statistical intricacies.
- CXL caters to data analysts by combining detailed breakdowns with educational insights to enhance understanding.
- Neil Patel's calculator shines for marketers needing visual clarity, with progress bars and percentage displays that make results easy to present to non-technical stakeholders.
- Convertize provides an interactive experience with dynamic charts, perfect for teams that prefer exploring data visually.
- Act-On focuses on delivering core metrics quickly for users who value speed and efficiency.
- ABTestGuide bridges the gap between statistical rigor and accessibility, offering both frequentist and Bayesian approaches with plain-language explanations.
Your choice should align with your workflow. Simpler tools are great for quick calculations, while advanced options suit in-depth analysis. If you're presenting to executives or clients, visual tools with interactive features can make your findings more engaging.
For additional support, explore complementary A/B testing solutions. A helpful resource is the Marketing Analytics Tools Directory, which organizes tools by functionality. This can help you discover specialized solutions to enhance your optimization efforts alongside these calculators.
FAQs
What’s the difference between frequentist and Bayesian approaches in A/B testing calculators?
The main distinction between frequentist and Bayesian approaches in A/B testing calculators lies in how they handle probability and data analysis. Frequentist methods rely on fixed probabilities and use null hypothesis significance testing to assess whether a result is statistically significant. These methods work best with larger sample sizes and assume the experiment could be repeated under identical conditions.
On the other hand, Bayesian methods view probability as a measure of belief that updates as new data comes in. This approach is particularly useful for smaller sample sizes or when prior knowledge is available. Bayesian calculators stand out by incorporating prior data into their analysis, making them a flexible choice for ongoing or iterative testing scenarios.
How can I choose the best statistical significance calculator for my A/B testing needs?
Choosing the right statistical significance calculator starts with understanding your testing approach and the features you need. Are you working with a frequentist or Bayesian method? Some calculators are tailored to one over the other, so this distinction matters. Also, think about the confidence level you’re aiming for - whether it’s 95% or 99% - and whether you’ll need extras like sample size estimation or post-test analysis.
If you’re looking for something quick and straightforward, go for a user-friendly tool. On the other hand, more advanced calculators are better suited for complex planning and in-depth analysis. Bayesian tools, in particular, are helpful if you prefer interpreting results in terms of probabilities. The key is to choose a calculator that matches the complexity of your experiments and delivers accurate, trustworthy results to guide your decisions.
Why is it important to evaluate both statistical and practical significance in A/B testing results?
Evaluating statistical significance and practical significance together is critical in A/B testing to make decisions that truly matter. Statistical significance tells you whether the results are unlikely to be due to chance, but it doesn't automatically mean the change is worth pursuing.
Practical significance, on the other hand, asks whether the observed effect is meaningful enough to influence your business or improve user experience. For instance, a statistically significant 0.1% boost in conversion rates might not be worth the time, effort, or cost of implementing the change. Ignoring this aspect can lead to wasted resources, while dismissing statistical significance risks basing decisions on unreliable data.
Balancing both ensures your decisions are grounded in solid data and deliver real value toward achieving your business objectives.