Cart abandonment is a big issue for online stores, with nearly 70% of shoppers leaving without buying. For mobile users, this jumps to over 85%. Tracking where and why customers abandon their carts helps businesses recover lost sales and improve checkout processes. Google Analytics, especially GA4, offers tools to monitor these drop-offs and take action.
Here’s a quick breakdown of how to track cart abandonment:
- Set up e-commerce tracking in Google Analytics (GA4 or Universal Analytics).
- Use funnel reports to pinpoint where users drop off during checkout.
- Track key steps like
add_to_cart,begin_checkout, andpurchase. - Analyze data to identify problem areas like unexpected fees or payment issues.
- Use insights to optimize checkout and run retargeting campaigns for cart abandoners.
Cart Abandonment Statistics and Key Metrics for E-commerce
How to Track Shopping Cart Abandonment
Requirements for Setting Up Cart Abandonment Tracking
To effectively track cart abandonment, you need to ensure Google Analytics is properly set up, e-commerce tracking is enabled, and your website supports the required tracking steps. Skipping any of these can lead to incomplete or inaccurate data.
Verify Your Google Analytics Setup

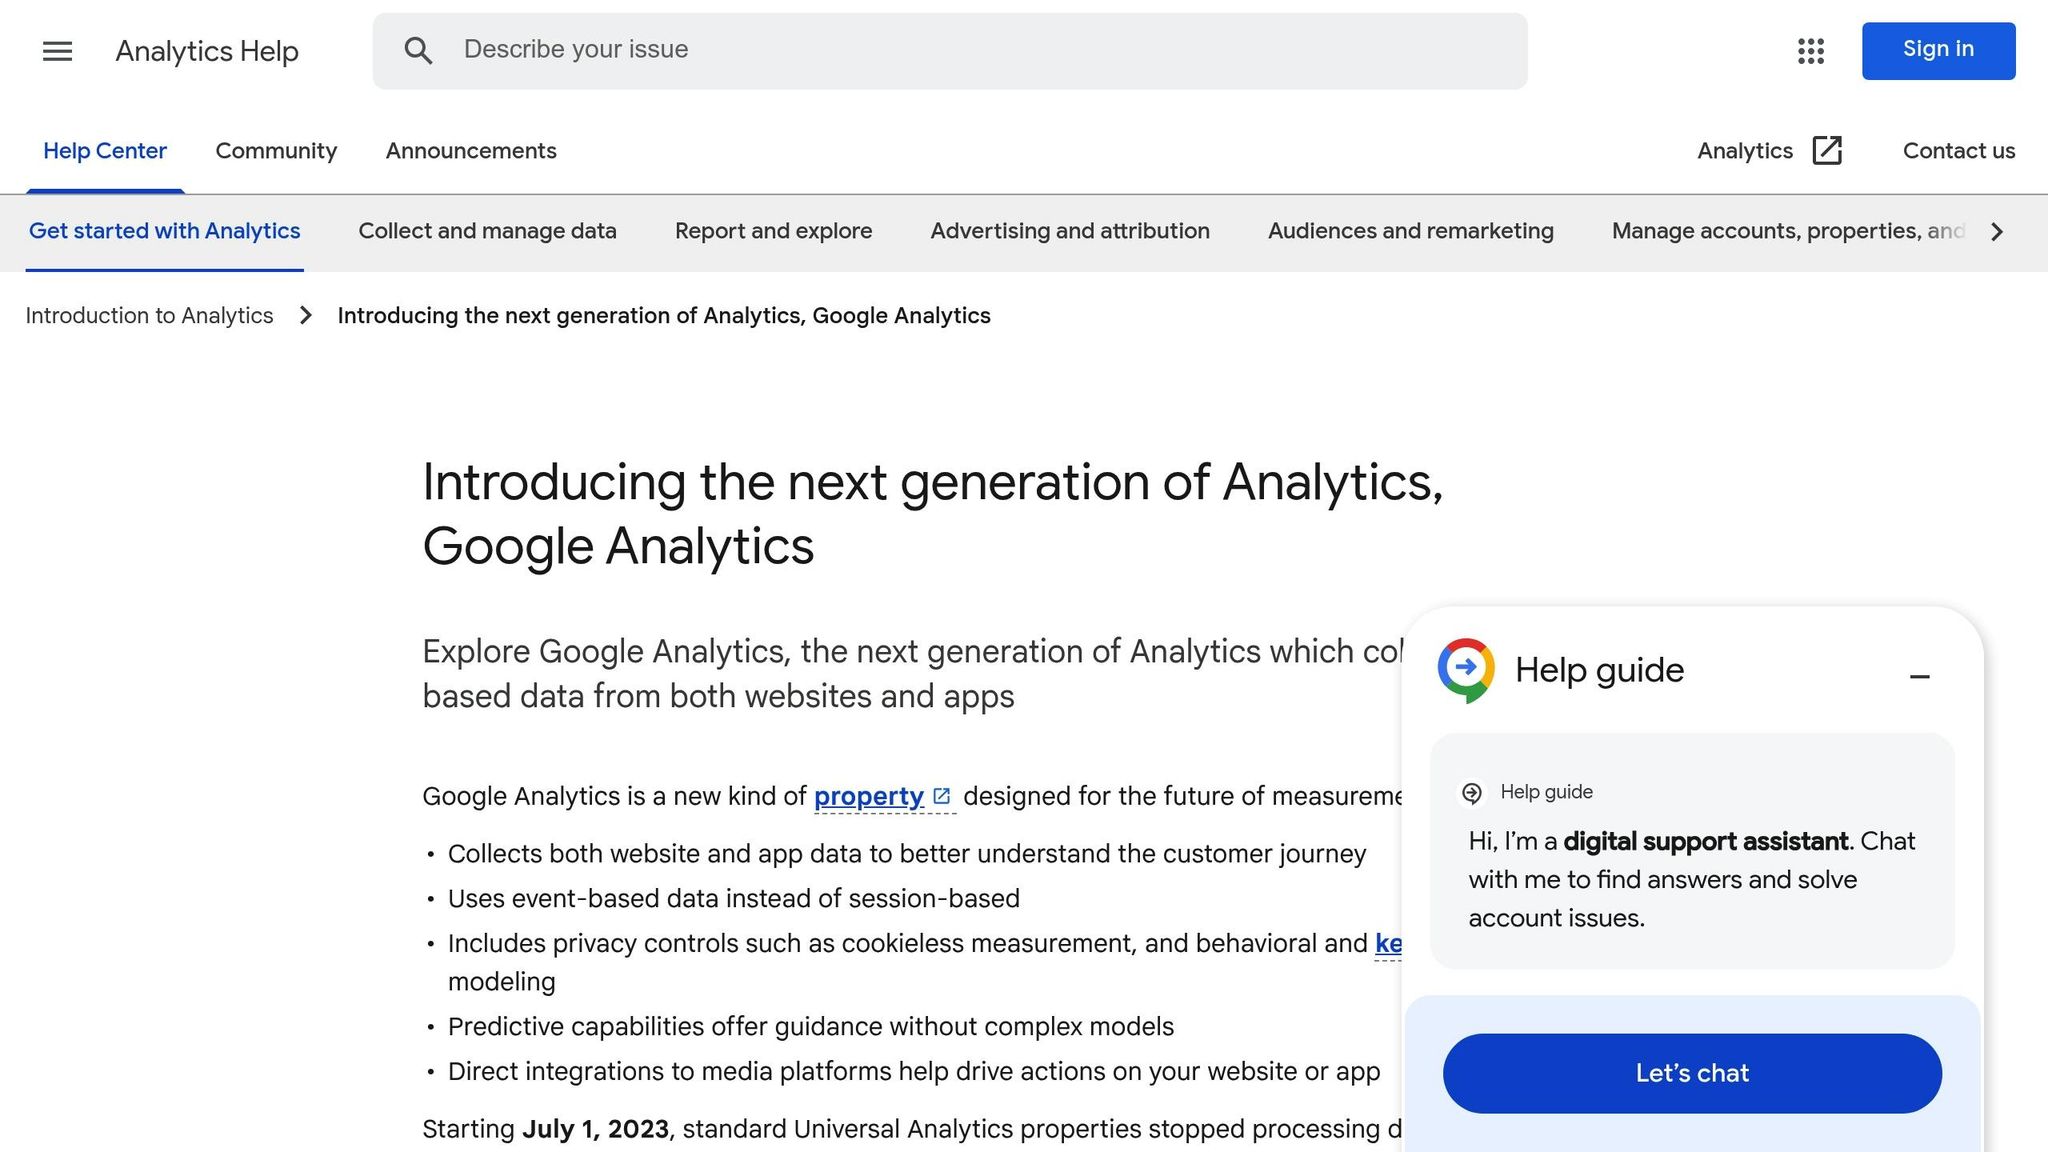
Start by identifying the version of Google Analytics you’re using - Universal Analytics (UA) or Google Analytics 4 (GA4). The two versions work differently: UA uses Views and Goals for tracking conversions, while GA4 relies on event-based tracking through Events and Explorations. Keep in mind that UA is being replaced by GA4, so it’s best to focus on GA4 if you’re setting up a new property.
For GA4 users, make sure you have Editor access to configure tracking settings and create audiences. This access is essential for setting up the necessary features.
Enable E-commerce Tracking
Activating e-commerce tracking is a key step. In Universal Analytics, go to the Admin panel, select your View, and enable both "Ecommerce" and "Enhanced Ecommerce Reporting." For GA4, you’ll need to set your property’s Industry category to Shopping, Travel, Real Estate, or Jobs & Education. This unlocks recommended dimensions and audience settings tailored to e-commerce.
In GA4, certain events must be active on your site to track user behavior effectively. These include events like view_item, add_to_cart, begin_checkout, and purchase. Use GA4's DebugView to verify these events in real-time. If you’re using Universal Analytics, ensure your website is tagged with either ec.js or gtag.js to enable Enhanced Ecommerce reports.
Prepare Your Website
Your website must be configured to support all necessary tracking steps. For Universal Analytics, each step in the checkout process - such as the cart, checkout, and confirmation pages - should have a static URL (e.g., /cart, /checkout, or /thank-you). If your site uses dynamic URLs with transaction IDs (e.g., /checkout/success/12345), use the "Begins with" match type to ensure accurate funnel tracking.
For GA4, events must be triggered using the Google tag (gtag.js) or Google Tag Manager (GTM). Make sure the tracking tag is present on every page in the checkout process. If you’re using platforms like Shopify or WooCommerce, confirm that their built-in e-commerce tracking features are enabled. Always run a test checkout to verify that tracking is working as expected.
How to Set Up Cart Abandonment Tracking in Universal Analytics
Note: This guide explains how to track cart abandonment in Universal Analytics. For GA4-specific instructions, check the next section.
Universal Analytics relies on Goals and Funnel Visualization to pinpoint where shoppers exit during the checkout process. While it's being phased out, many businesses still use it for historical data and existing reports.
Create and Configure a New Goal
To start, ensure your Universal Analytics setup is ready. Then, define a conversion goal. Click the gear icon in the lower-left corner to access the Admin section. Select the correct Account and Property, then navigate to Goals under the View column. Click + New Goal and choose the Custom option to manually set your tracking parameters.
Give your goal a clear name, like "Completed Order" or "Checkout Success", and select Destination as the goal type. In the Goal Details section, input the relative URL of your final confirmation page, such as /thank-you or /order-received. Use only the part of the URL after the forward slash. If your URLs include unique order IDs (e.g., /checkout/success/12345), opt for the Begins with match type instead of Equals to.
To check your setup, click Verify this goal to see how often it would have converted based on data from the past seven days. Remember, Universal Analytics allows up to 20 goals per reporting view, and tracking begins only after the goal is created - it doesn’t capture past data.
Enable Funnel Visualization
Once your goal is set, you can configure funnel visualization to track each step in the checkout process. In the Goal Details section, enable the Funnel option. This will let you define each step users take before completing their purchase. Add the name and relative URL for each stage, like /cart for the shopping cart page and /checkout for the checkout page.
You’ll notice a Required toggle for the first step. If users can reach checkout through multiple paths - such as a "Buy Now" button or a cart icon - set this toggle to Off to ensure all abandonment data is captured. This setup highlights where users are dropping off during the process.
After saving your goal, it may take up to 24 hours for data to appear in your reports. To view your cart abandonment insights, go to Conversions > Goals > Funnel Visualization. This report will show exactly where users are leaving the checkout process.
How to Configure Cart Abandonment Tracking in GA4
Google Analytics 4 (GA4) makes it easier to track cart abandonment with its Funnel Exploration tool, which provides a clear look at where shoppers drop off during the checkout process.
Create a Funnel Exploration
Start by navigating to the Explore section in GA4 and selecting the Funnel Exploration template.
You can define up to 10 sequential steps based on events or dimensions. GA4 offers two types of funnels:
- Standard funnel: A stepped bar chart showing absolute numbers and drop-offs at each stage.
- Trended funnel: A line chart that tracks how the funnel performs over time.
For tracking cart abandonment, the Standard funnel is usually the better choice since it highlights specific problem areas.
Make sure to switch from the default closed funnel to an open funnel. This ensures you capture all checkout paths, not just the predefined ones. Set each step to "is indirectly followed by" to include users who visit intermediary pages. This setup lays the groundwork for pinpointing where users abandon their carts.
Define Key Funnel Steps
To create a basic funnel, use these events:
add_to_cart→begin_checkout→purchase
If you want to get a deeper understanding of where friction occurs, consider adding additional steps like add_shipping_info and add_payment_info.
For extra insights, add Device category as a breakdown dimension. This can help you identify if mobile users are abandoning their carts more frequently than desktop users. Toggle on "Show elapsed time" to see how long users spend between steps - long delays might indicate confusing interfaces or technical issues. You can also drag the Event name dimension into the Next action field. This allows you to hover over funnel bars and see the top five events users triggered instead of completing their purchase.
Once you're satisfied with your funnel, save it to the Library so your team can access and analyze it. While some data may appear within a few hours, it can take up to 24 hours for complete accuracy.
sbb-itb-5174ba0
How to Analyze Cart Abandonment Reports
Digging into your cart abandonment data can help you understand where users are dropping off during the checkout process. Both Universal Analytics (UA) and GA4 offer tools to analyze this information, each with unique features. Here's how you can make the most of them.
Access Reports in Universal Analytics
In Universal Analytics, head over to Conversions > Ecommerce > Shopping Behavior. This report provides a visual breakdown of your shopping funnel, showing how users move through each step - from browsing products to completing a purchase - and where they exit the process. For a more detailed look at the checkout stages, check out the Checkout Behavior report in the same section.
You can also explore Goal-based funnels under Conversions > Goals > Funnel Visualization. A particularly handy feature in UA is the ability to click on the red abandonment arrows in the Shopping Behavior report. This lets you segment users who abandoned their carts, making it easier to target them for remarketing campaigns.
Analyze Funnel Reports in GA4
GA4 offers a more flexible and detailed approach to analyzing cart abandonment, especially with its cross-device tracking capabilities. Start by navigating to Reports > Monetization > Checkout journey. This predefined funnel report highlights the abandonment rate at each stage, showing the percentage of users who drop off between steps.
For a deeper dive, use the Funnel Exploration tool under the Explore tab. Here, you can customize your analysis by adding filters like Device category, Browser, or Country/Region. For example, if mobile users abandon their carts more frequently than desktop users, it might be time to optimize your mobile checkout experience. You can also drag Event name into the Next action field to see what users do instead of completing their purchase. Hovering over the funnel bars reveals the top five actions users take at each step.
Pay close attention to significant drop-offs between specific steps. For example, if there's a major decline between "Add Shipping" and "Add Payment", it could point to issues like unexpected shipping costs or limited payment options. To ensure that key events like add_to_cart, begin_checkout, and purchase are firing correctly, use the DebugView tool under Admin > Data display > DebugView. This can help you confirm that your tracking is set up properly and identify any potential gaps.
Key Metrics and Ways to Reduce Cart Abandonment
Metrics to Monitor
To get a clear picture of your cart abandonment data, focus on the cart abandonment rate, calculated as:
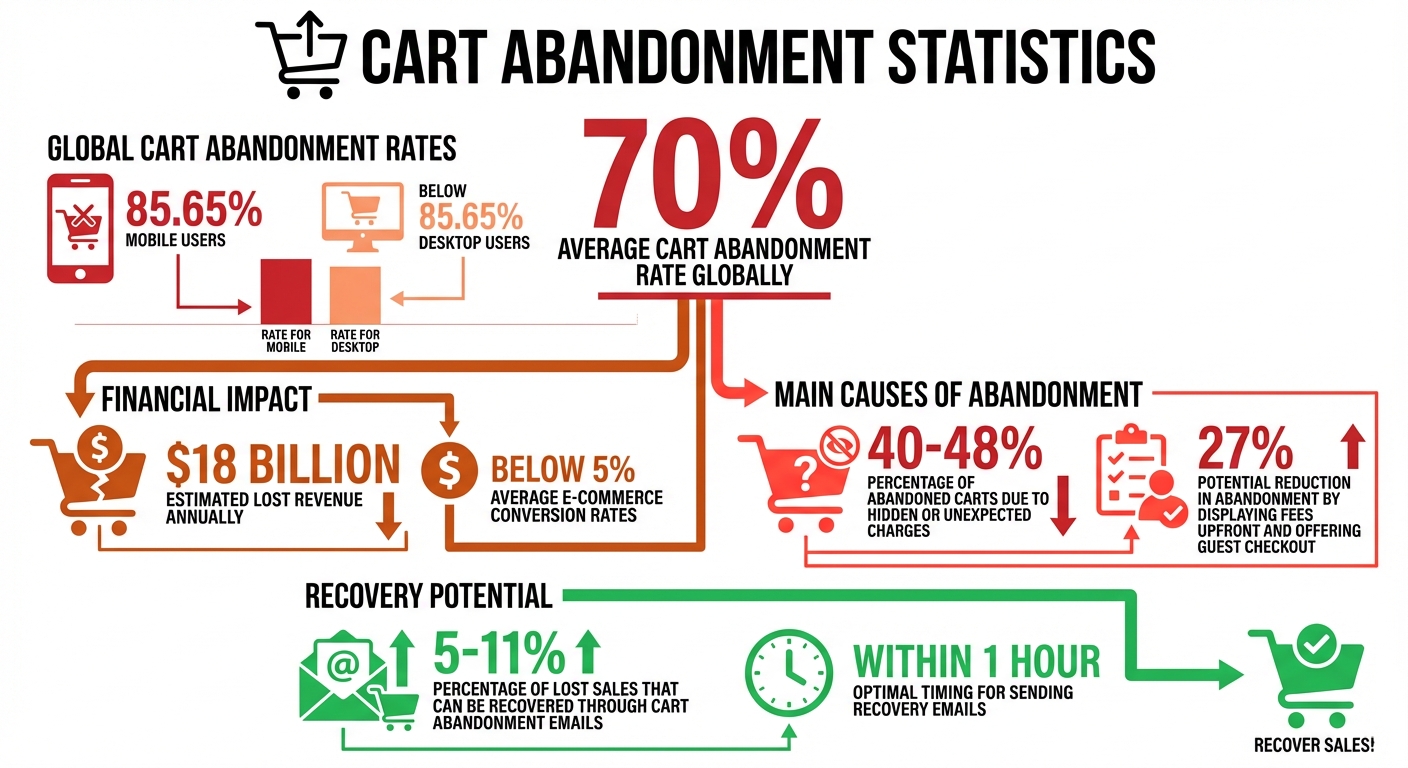
1 – (completed transactions ÷ adds to cart). On average, 70% of carts are abandoned globally, with mobile users seeing an even higher rate of 85.65% compared to desktop users. Additionally, keep an eye on the checkout abandonment rate, which measures users who start the begin_checkout process but don’t complete their purchase.
Another critical metric is the drop-off rate at each step of the checkout funnel. For instance, if a significant number of users abandon the process between "Add Payment Info" and "Purchase", that step may need attention. Comparing device-specific performance (mobile, desktop, tablet) can also reveal valuable insights.
Track the average order value (AOV) for abandoned carts versus completed purchases and analyze the time it takes users to complete checkout. A lengthy checkout process often correlates with higher abandonment rates.
Once you've identified the problem areas, it's time to implement strategies to reduce cart abandonment.
Tips for Reducing Cart Abandonment
One of the simplest ways to reduce abandonment is to display all fees upfront and offer a guest checkout option with simplified fields. These changes alone can cut abandonment rates by up to 27%. Hidden or unexpected charges are a major issue, responsible for 40% to 48% of abandoned carts.
For mobile users, ensure touch targets are at least 44×44 px for easy navigation and integrate digital wallets like Apple Pay to streamline payments. Adding a progress indicator during checkout can also help by showing users how many steps remain, reducing the perceived effort.
To recover lost sales, use exit-intent popups that offer discounts or special deals. Follow up with automated recovery emails sent within an hour of abandonment. These emails have been shown to recover 5% to 11% of lost sales.
"Studies show that the average person gets 1 interruption every 8 minutes, while the average employee gets interrupted 56 times a day. This is where cart abandonment emails come into play. By sending out one or more emails, companies can typically recover between 5% and 11% of otherwise lost sales."
- Carl Sednaoui, Director of Marketing at MailCharts
Finally, use tools like GA4 to create custom audiences of cart abandoners for targeted remarketing campaigns on Google Ads. GA4’s predictive audiences can even help identify users who are likely to abandon, allowing you to take proactive measures.
Conclusion
Tracking cart abandonment in Google Analytics isn’t just about collecting numbers - it’s about uncovering the exact moments where potential customers decide to leave their carts behind. Considering that over 70% of online shoppers abandon their carts, leading to an estimated $18 billion in lost revenue annually, having the right tracking tools in place can transform guesswork into actionable insights.
Whether you’re leveraging Universal Analytics with goal funnels or GA4’s event-based Funnel Exploration reports, the goal is the same: map out the customer journey from browsing to purchase. By keeping an eye on metrics like cart abandonment rate, checkout abandonment rate, and funnel drop-offs, you can identify the specific points where users encounter obstacles.
As Mike Arsenault, Founder & CEO of Rejoiner, explains:
"Setting up a funnel in your account allows you to identify 'leaky buckets' when it comes to conversion on your site that you wouldn't otherwise be able to see."
- Mike Arsenault
The real power lies in turning these insights into action. Streamline your checkout process, make pricing transparent, offer guest checkout options, and use remarketing strategies to win back lost customers. With e-commerce conversion rates averaging below 5%, even small tweaks to reduce abandonment can lead to noticeable revenue growth.
FAQs
What are the main causes of cart abandonment in online shopping?
Cart abandonment often occurs for a handful of predictable reasons. One big culprit? Unexpectedly high shipping costs. Nothing sours the excitement of a purchase faster than seeing fees pile up at checkout. Another common frustration is a complicated or drawn-out checkout process, especially when customers are forced to create an account before buying. And let’s not forget technical glitches - slow-loading pages, particularly on mobile devices, can quickly drive shoppers away.
To combat this, businesses should focus on a few key areas: keep the checkout process straightforward, clearly display all costs upfront, and ensure their website runs smoothly on mobile devices. These steps can go a long way in turning hesitant browsers into happy buyers.
What are the key differences between Google Analytics 4 and Universal Analytics for tracking cart abandonment?
Google Analytics 4 (GA4) takes a modern, event-focused approach to tracking cart abandonment, offering tools that make it easier to follow user behavior during the shopping process. With GA4, you can track key actions like add_to_cart, begin_checkout, and purchase using enhanced e-commerce events. These events give you a clear picture of how users interact with your site. Plus, GA4’s Funnel Exploration tools let you visually map out the checkout process, highlighting exactly where users drop off. This makes pinpointing and addressing problem areas much more straightforward.
Universal Analytics, on the other hand, relied on goal-based tracking and required more effort to set up e-commerce funnels. GA4’s event-driven design not only simplifies tracking but also offers richer insights into user behavior, giving businesses the tools they need to tackle cart abandonment more effectively.
What are the best ways to reduce cart abandonment rates?
Reducing cart abandonment starts with figuring out why shoppers leave their carts behind. Tools like Google Analytics can help by showing exactly where users drop off during the checkout process, giving you insight into areas that need improvement.
Here are some strategies to tackle cart abandonment:
- Be upfront about costs: Clearly display shipping fees, taxes, and any extra charges early on to avoid unpleasant surprises at checkout.
- Streamline the checkout process: Keep forms short and eliminate unnecessary steps to make buying as quick and hassle-free as possible.
- Offer guest checkout options: Let customers complete their purchase without forcing them to create an account.
- Ensure a smooth shopping experience: Fix bugs, improve page loading speeds, and make sure your site is mobile-friendly.
By digging into cart abandonment data and addressing these common roadblocks, businesses can create a frustration-free shopping experience that helps turn abandoned carts into completed sales.