Want to keep users coming back to your Android app? Tracking retention is key, especially when most apps lose 93-95% of users within the first month. Retention tools help you understand why users leave and how to improve their experience. Below are five tools that can help improve user retention through data-driven insights:
- Firebase Analytics: Free, Google-integrated tool with event tracking and cohort analysis.
- Mixpanel: Advanced event tracking and funnel analysis with plans starting at $25/month.
- UXCam: Visual session replays and heatmaps starting at $79/month.
- CleverTap: AI-powered insights and multi-channel messaging, starting at $75/month.
- Pushwoosh: Focus on engagement with push notifications, starting at $49/month.
Each tool offers unique features to suit different needs and budgets. Whether you're looking for a free solution or advanced analytics, there's an option for you. Below, we break down their key features, pricing, and use cases.
Mobile User App Retention: How to stop losing App Users
1. Firebase Analytics
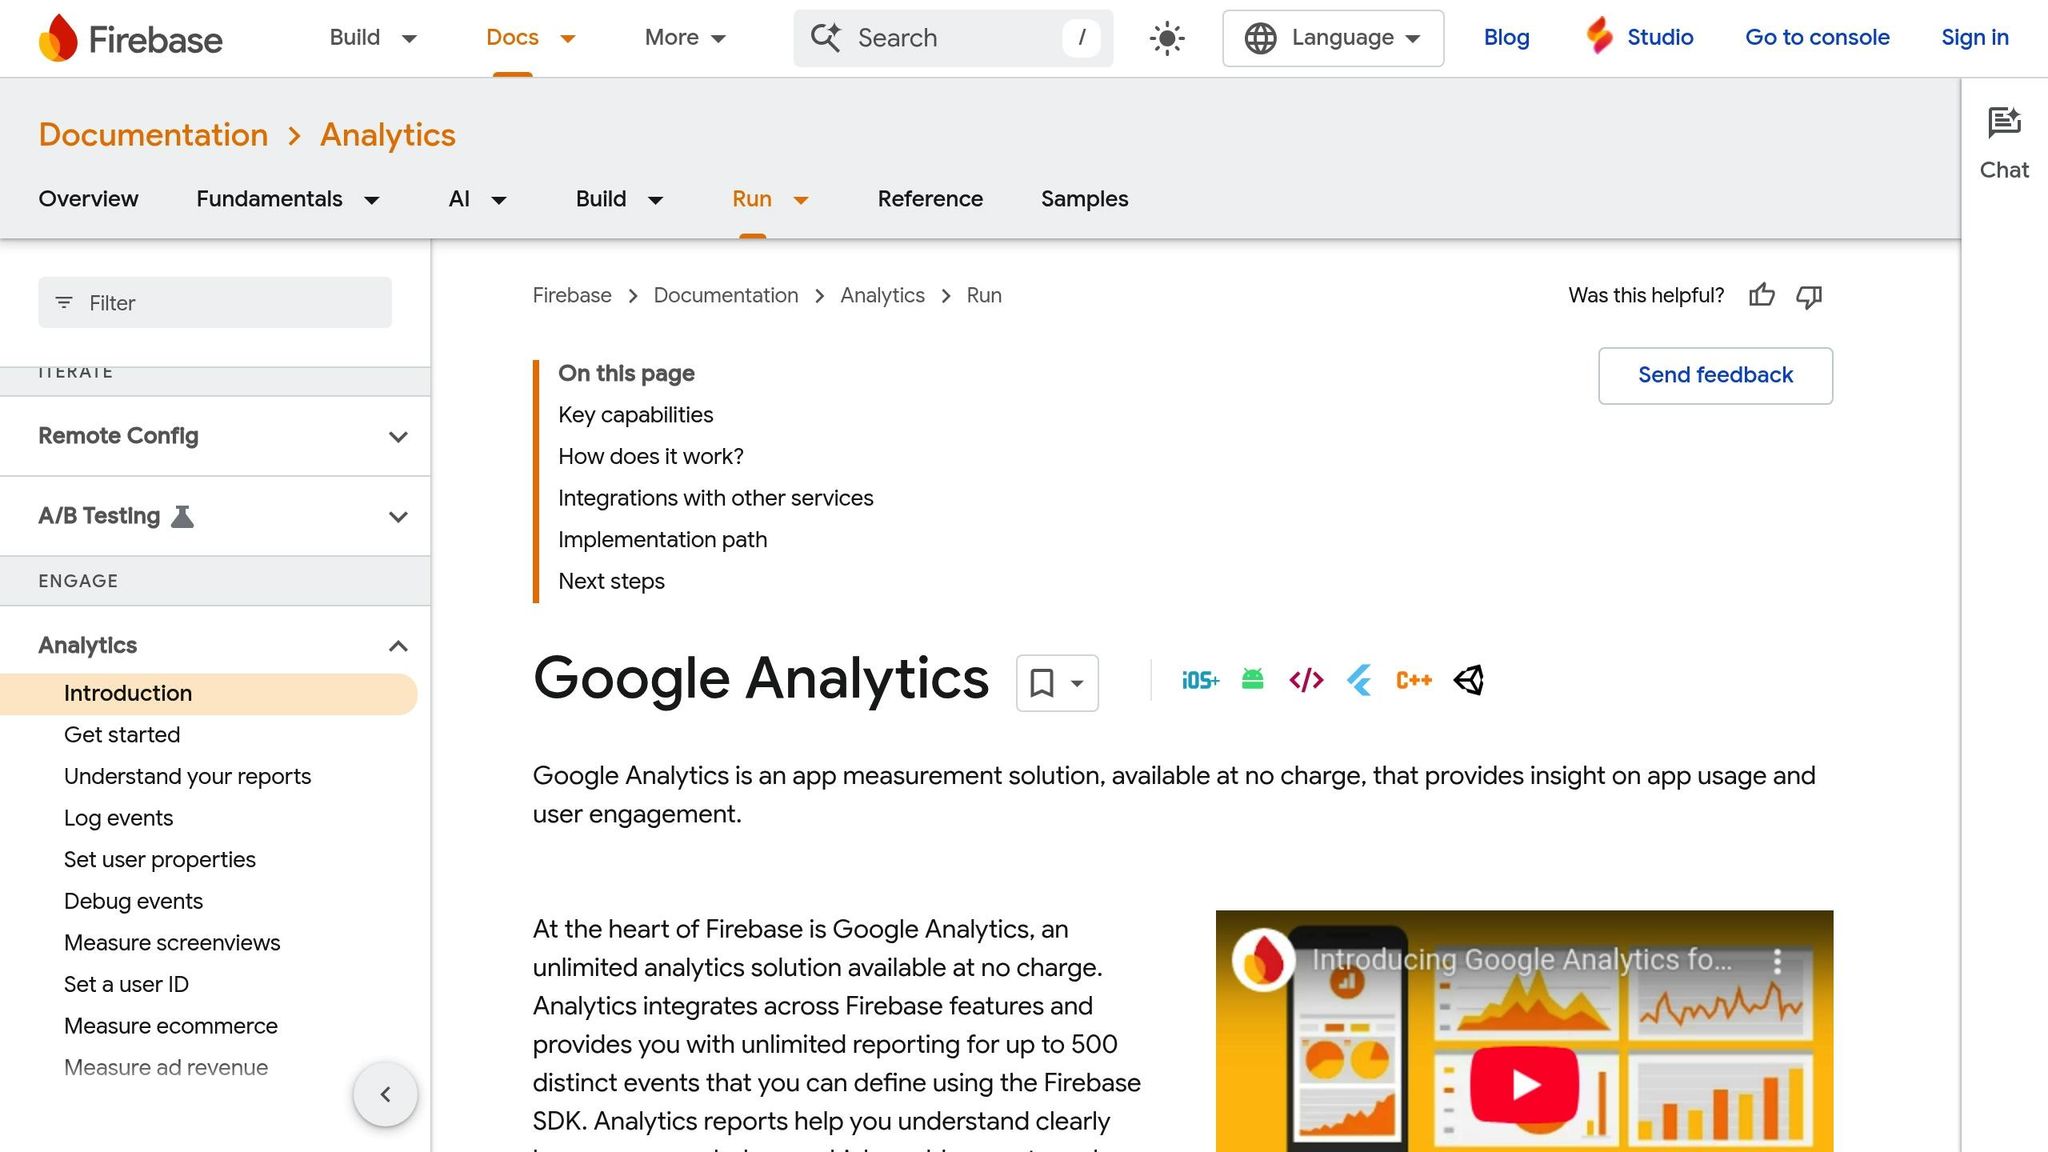
Firebase Analytics is Google's go-to analytics platform for Android apps, offering a cost-free solution that developers and marketers rely on for tracking user retention. Its advanced tracking tools provide a solid foundation for analyzing user behavior and app performance.
Event Tracking Capabilities Specific to Android
When it comes to tracking events, Firebase Analytics shines on Android. It automatically captures key metrics like app installs, updates, and user engagement with minimal configuration. On top of that, developers can define up to 500 custom event types to monitor specific actions, such as app launches, session lengths, or interactions with particular features.
Take this example: A fitness app used Firebase Analytics to analyze user interactions with their workout plans. The data revealed a sharp drop-off after the onboarding process. By redesigning that experience, the app saw a 15% boost in user retention.
Retention Cohort Analysis
Firebase Analytics includes a built-in retention cohort analysis tool that groups users based on when they first used the app. This feature tracks how often those users return over time, helping teams identify trends, detect drop-off points, and measure the effects of updates or marketing campaigns. These insights empower teams to make changes that improve user retention.
Integration with Other Tools
Firebase Analytics works seamlessly with other Google tools like Google Ads, BigQuery, and Google Data Studio, making it easy to build a unified analytics system. It also supports third-party APIs, allowing businesses to incorporate Firebase data into their existing workflows without needing a complete overhaul.
Reporting and Visualization Features
The platform provides real-time, customizable dashboards for quick reporting. Pre-built reports help teams identify issues and act quickly, while deeper insights can be uncovered by exporting data to BigQuery and visualizing it in tools like Google Data Studio. Firebase Analytics has a G2 rating of 3.9/5, with users appreciating its simple setup and smooth integration with Google's ecosystem. However, some have mentioned that its advanced reporting features could be improved.
With its no-cost model and Android-specific tools, Firebase Analytics is an excellent choice for tracking retention and understanding user behavior in Android apps.
2. Mixpanel
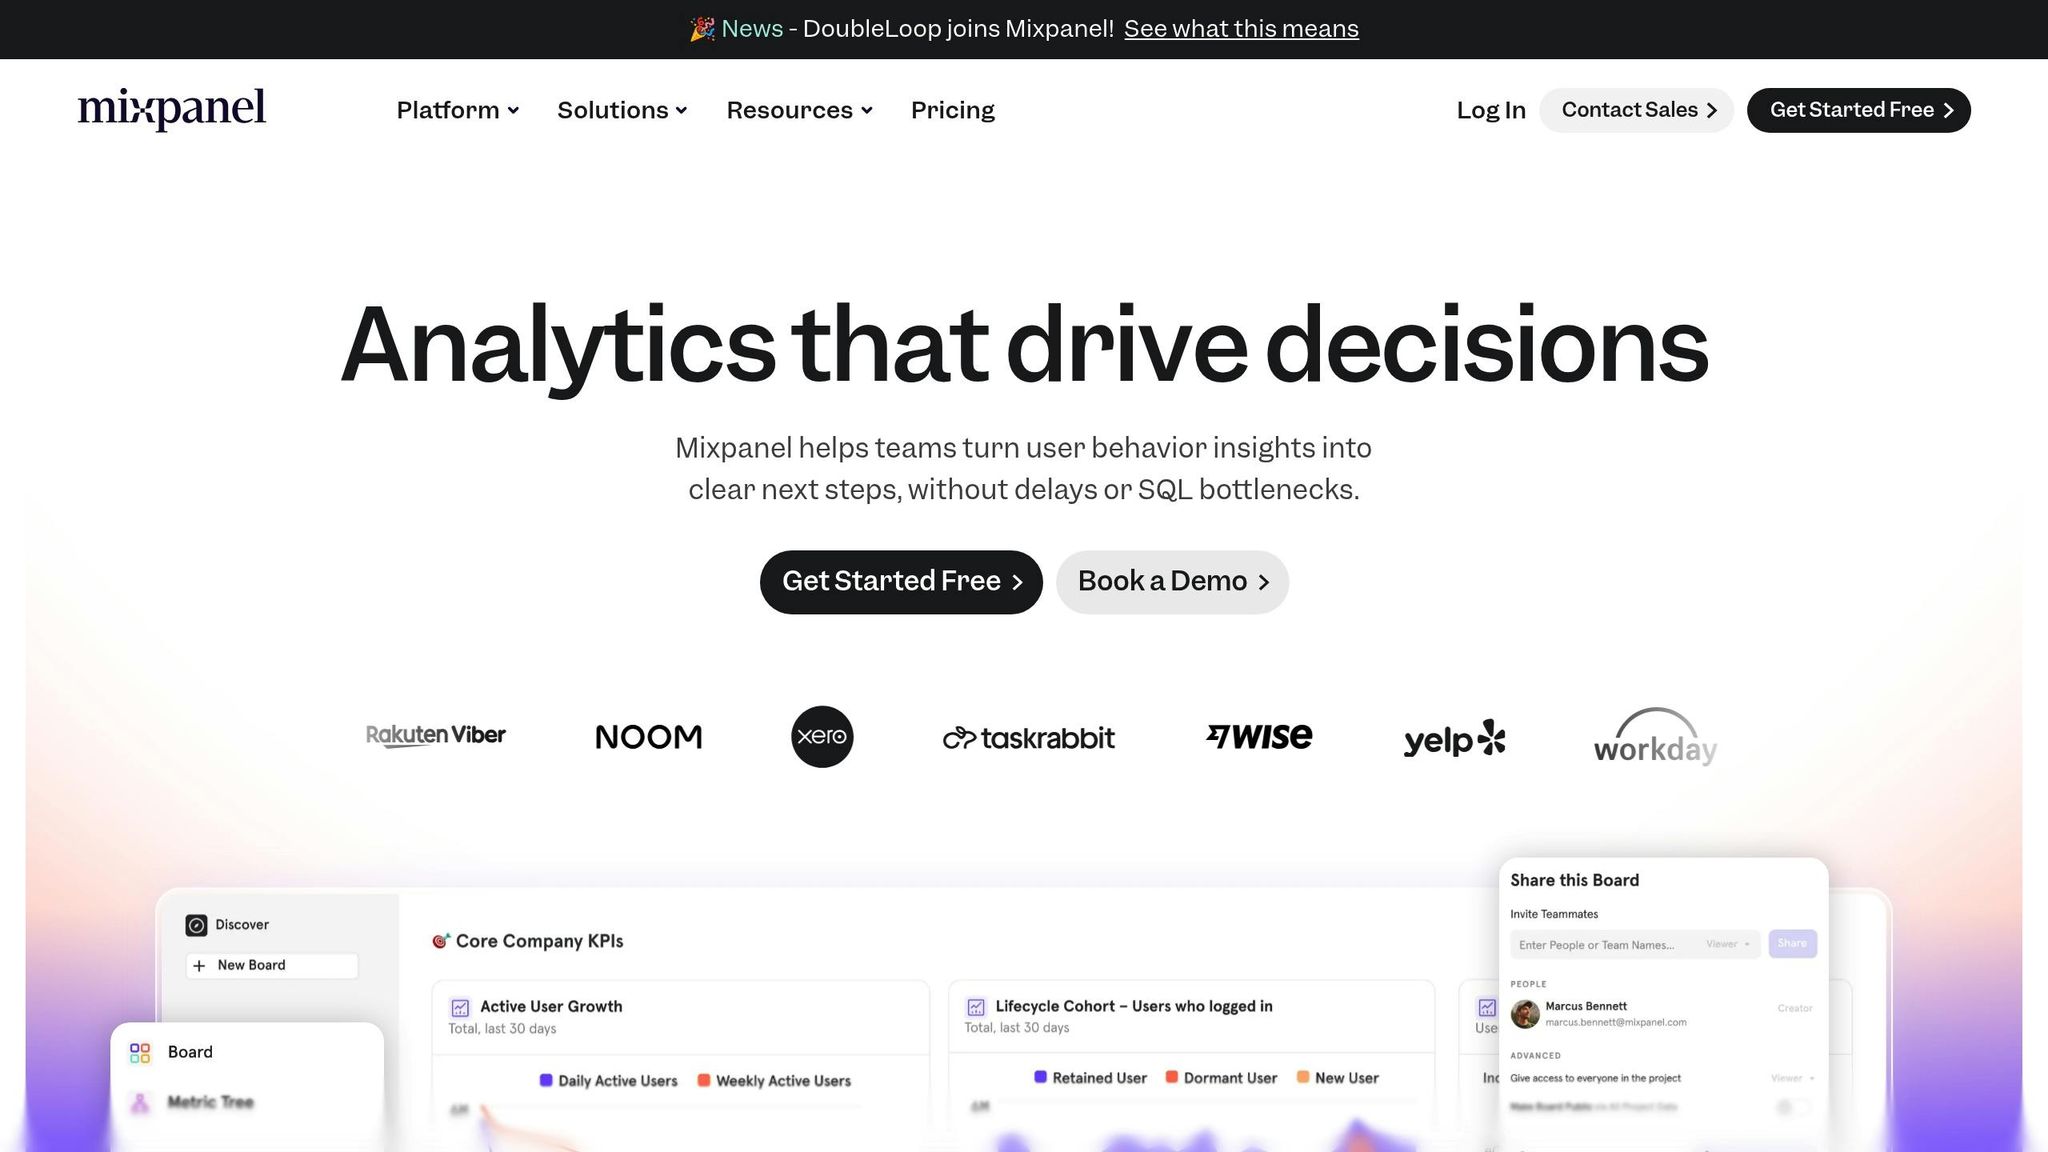
Mixpanel stands out as a highly-rated tool for Android app developers, offering precise event tracking and retention analysis. It provides actionable insights into user behavior, making it easier to refine retention strategies and improve app performance.
Event Tracking Capabilities Specific to Android
Mixpanel enables detailed event tracking for Android apps, capturing data on user interactions like page views, button clicks, and feature usage. This level of granularity helps teams understand how users engage with different features and navigate through the app.
Retention Cohort Analysis
One of Mixpanel's strengths is its retention cohort analysis. It groups users based on key actions, such as when they installed the app or created an account, and tracks how often they return over time. This approach helps teams uncover retention trends, compare user behavior across different acquisition periods, and assess the effects of product updates. With custom segmentation, the analysis becomes even more precise.
Integration Options with Existing Analytics Stacks
Mixpanel provides Android SDKs that integrate smoothly with existing analytics tools like Google Analytics 4 (GA4). This compatibility allows teams to combine insights from multiple platforms without creating data silos. Additionally, its API support for data import and export offers flexibility for integrating with broader analytics ecosystems.
Reporting and Visualization Features
The platform offers a range of reporting tools, including customizable dashboards, funnel visualizations, retention curves, and cohort charts. These features make it easy for teams to identify drop-off points, analyze user engagement, and create tailored reports. Metrics like daily active users, retention rates, and conversion funnels are presented in a clear, accessible format for stakeholders across teams.
For instance, a SaaS productivity app increased its setup completion rate from 40% to 75% by using Mixpanel's funnel analysis to refine its mobile onboarding flow.
Mixpanel's pricing is designed to accommodate businesses of all sizes. It includes a free plan for startups, while its Growth plan - with advanced analytics and added integrations - starts at $25 per month. Up next, we'll examine another powerful tool offering unique insights into Android app retention.
3. UXCam
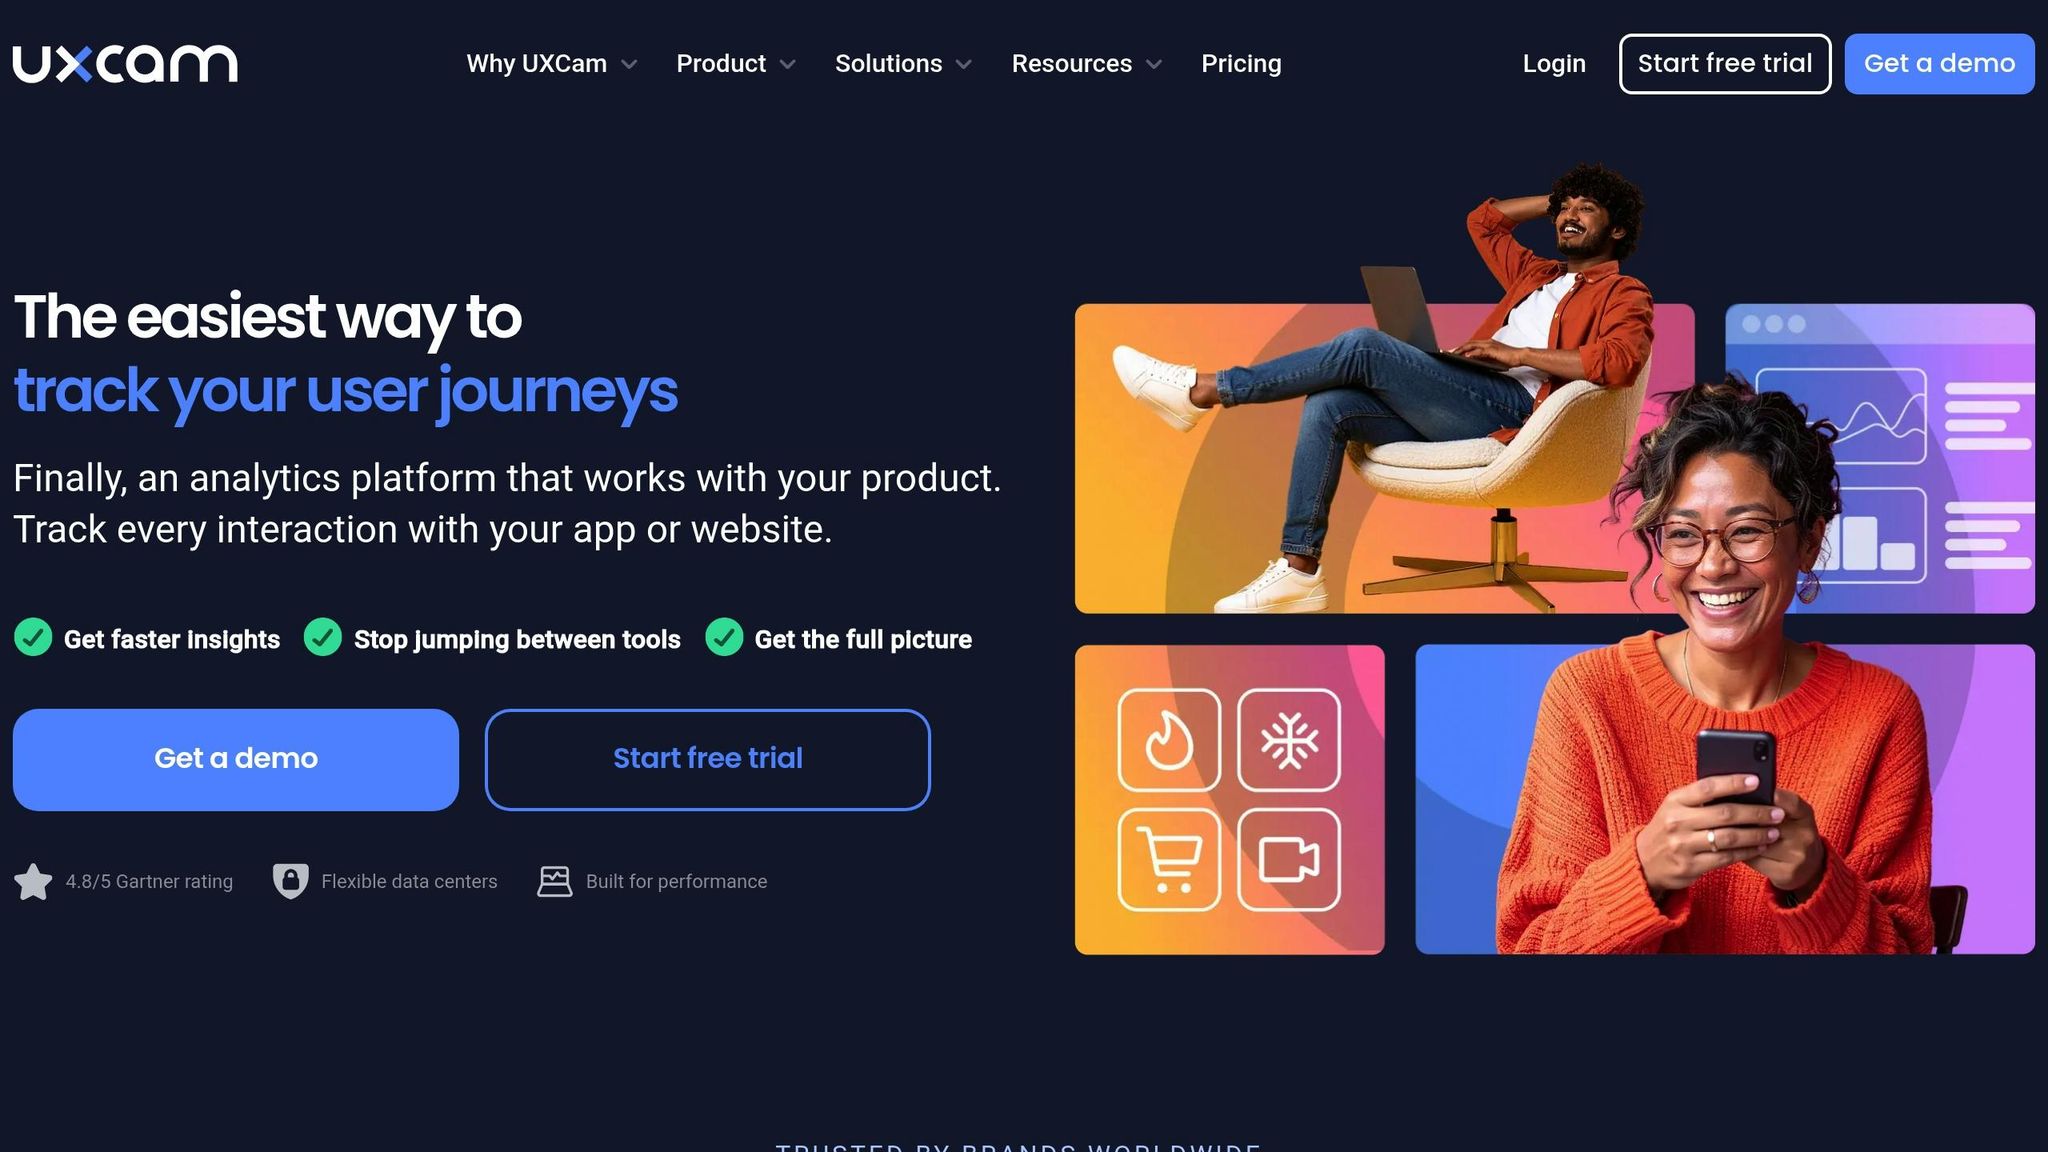
UXCam takes retention tracking to the next level by introducing a visual layer to traditional analytics. It combines event tracking, cohort analysis, session recordings, and heatmaps to help teams understand not just what users do, but why they behave the way they do. This approach makes it easier to pinpoint and address retention challenges on Android apps.
Event Tracking Designed for Android
UXCam simplifies tracking Android user interactions by automatically capturing actions like taps, swipes, gestures, and screen transitions. It also allows for custom event definitions, giving teams flexibility in monitoring app behavior. Thanks to its lightweight SDK, the platform ensures minimal impact on app performance, which is key to maintaining a smooth user experience.
One standout feature is its ability to map navigation patterns between screens. This provides essential context behind user actions, making it easier to identify friction points that could negatively affect retention.
Cohort Analysis for Retention Insights
UXCam groups users into cohorts based on factors like first usage date, specific actions taken, or custom properties. This segmentation allows teams to track how different user groups return to the app over time. By comparing retention rates across acquisition channels or feature updates, teams can pinpoint which segments are more likely to stay engaged and which need extra attention.
The platform’s cohort analysis tools make it easy to spot patterns and trends that might otherwise go unnoticed. Teams can quickly assess how product changes impact various user groups and adjust their retention strategies accordingly.
Easy Integration with Analytics Tools
UXCam works seamlessly with popular analytics platforms like Google Analytics, Mixpanel, and Slack. These integrations allow teams to create a more comprehensive understanding of user behavior. APIs make the connection process straightforward, enabling workflows where session recordings can be linked to specific events tracked in other tools. This helps teams uncover the qualitative insights behind the numbers.
Visual Reporting and Analytics
One of UXCam’s biggest strengths lies in its visual analytics features. Session replays let teams see exactly how users interact with the app, while heatmaps highlight areas of high engagement or user struggle. These tools make it easy to identify where users lose interest or encounter issues.
The platform’s interactive dashboards include features like funnel analysis, retention curves, and user journey maps. Teams can also create custom reports that combine visual insights with traditional metrics, making it easier to share findings with stakeholders.
An Android e-commerce app leveraged UXCam’s session replay and heatmap tools to discover that users were abandoning the checkout process due to a confusing button layout. After redesigning the checkout screen based on these insights, the team boosted their 7-day retention rate by 12%.
UXCam offers a free plan with basic features, while advanced analytics capabilities start at around $79 per month. With over 37,000 apps worldwide relying on the platform, UXCam proves to be a powerful tool for retention tracking. Next, CleverTap continues our exploration of retention solutions.
sbb-itb-5174ba0
4. CleverTap
CleverTap brings a fresh approach to retention tracking for Android apps by blending AI-powered insights with a focus on customer engagement. This platform isn’t just about tracking numbers - it’s about understanding user behavior and driving meaningful interactions. With over 10,000 apps across various Android categories relying on it, CleverTap has earned strong ratings: 4.5/5 on Capterra and 4.6/5 on G2. These scores speak to its reliability and popularity in the retention analytics world.
Event Tracking Tailored for Android
CleverTap’s event tracking is designed with Android apps in mind. It captures key user actions like app launches, screen views, button clicks, in-app purchases, and even custom events. The data is processed in real time, enabling teams to create personalized messages and segment users more effectively.
Retention Cohort Analysis
CleverTap’s cohort analysis tools make it easy to monitor user retention over time. By grouping users based on when they performed key actions - like installing the app or signing up - you can track their activity over days, weeks, or months. This helps identify trends and patterns, such as which marketing channels deliver users who stick around longer. These insights allow teams to fine-tune their strategies, ensuring resources are focused on what works best. Plus, the segmentation integrates smoothly with external analytics tools, making it easier to connect the dots.
Integration with Existing Analytics Tools
CleverTap plays nicely with other platforms like Zapier, Amplitude, and mParticle. These integrations ensure data flows effortlessly between CleverTap and your existing analytics stack, eliminating the need for time-consuming manual exports. This streamlined connectivity makes it easier to build comprehensive reports and keep all your tools in sync.
Reporting and Visualization
The platform’s dashboards are both intuitive and customizable, showcasing retention curves, funnel drop-offs, and engagement metrics through interactive charts and graphs. You can generate real-time analytics reports or set up automated reporting to keep your team in the loop. Clever.AI, CleverTap’s built-in AI assistant, adds another layer of functionality by offering automated recommendations to improve engagement and retention. It also tracks the performance of multi-channel messaging - push notifications, SMS, email, and in-app messages - helping you understand how each channel impacts retention across different user groups. However, users have noted some limitations, such as less flexibility in the in-app messaging editor and occasional inconsistencies with conversion goal tracking.
Pricing
CleverTap’s pricing starts at $75 per month. The data storage duration depends on the plan: the Essential plan keeps user history for one year, while the Advanced plan extends this to three years. This flexibility is crucial for teams aiming to conduct long-term retention analysis.
5. Pushwoosh
Pushwoosh blends analytics with automated engagement, making it easier to track user behavior and send personalized messages. Handling billions of push notifications every month and serving thousands of apps globally, it’s a go-to tool for teams aiming to boost retention through active user engagement.
Event Tracking Capabilities Specific to Android
Pushwoosh excels in event tracking for Android, capturing key user actions like app launches, feature interactions, and in-app purchases. These tracked events can trigger automated responses - like a retention message following a first purchase. The platform also segments users based on their engagement levels, allowing teams to fine-tune re-engagement strategies for better results.
Retention Cohort Analysis
With its cohort analysis tools, Pushwoosh groups users based on their engagement habits. By monitoring metrics like daily active users (DAU) and monthly active users (MAU), it helps you identify patterns and measure how different user groups respond to updates or campaigns. This segmentation becomes even more effective when paired with targeted messaging, enabling you to spot users at risk of churning and re-engage them with customized campaigns.
Integration Options with Existing Analytics Stacks
Pushwoosh integrates smoothly with your existing analytics stack, offering RESTful APIs and a lightweight Android SDK. It works seamlessly with platforms like Firebase, Mixpanel, and custom business intelligence tools, ensuring your retention data syncs effortlessly across systems. This eliminates the hassle of manual data transfers while maintaining reliable data collection without affecting app performance.
Reporting and Visualization Features
The platform provides real-time dashboards that showcase critical retention metrics, including user engagement, campaign performance, DAU, MAU, and user journey insights. Built-in A/B testing and automated reporting help refine messaging strategies. These dashboards are intuitive and customizable, offering a comprehensive view of how your engagement efforts influence retention. However, some users have noted that the most advanced analytics features are reserved for higher-tier plans.
Pushwoosh offers a free plan with basic functionality, while its paid plans start at around $49 per month, unlocking advanced analytics and automation tools. It’s also listed in the Marketing Analytics Tools Directory, making it easier for businesses to explore and compare top solutions for tracking, campaign performance, and audience insights in real time.
Tool Comparison Table
Each tool brings unique features to the table for improving Android user retention. The right choice depends on your budget, technical requirements, and the depth of analytics you need.
| Tool | Key Features | Pricing (USD) | Pros | Cons | Platform Support |
|---|---|---|---|---|---|
| Firebase Analytics | Event-based tracking, cohort analysis, unlimited reporting on up to 500 events, predictive analytics, Google ecosystem integration | Free | Free tier with robust features, seamless Google integration, easy setup | Limited advanced segmentation, less customizable than competitors | Android, iOS, Web |
| Mixpanel | Granular event tracking, funnel analysis, retention analysis, cohort segmentation, A/B testing | Free tier available; paid plans start at $25/month | Strong cohort analysis, flexible event tracking, effective A/B testing | Steeper learning curve, higher costs for advanced features | Android, iOS, Web |
| UXCam | Session recordings, heatmaps, user journey mapping, crash analytics, visual insights | Custom pricing starting around $79/month | Visual session replays, actionable qualitative insights, simple integration | Limited tracking history on free plan, lacks some advanced analytics | Android, iOS, Web, Desktop frameworks |
| CleverTap | Automated segmentation, personalized messaging, retention analytics, campaign management, AI-powered insights | Custom pricing starting at $75/month | Multi-channel messaging, automated engagement, strong retention analytics | Higher cost with custom pricing, may require technical setup | Android, iOS, Web |
| Pushwoosh | Multi-channel messaging, push notification automation, audience segmentation, real-time analytics | Free tier available; paid plans start at $49/month | Multi-channel support, real-time analytics, user-friendly interface | Limited analytics depth compared to specialized platforms, pricing increases with scale | Android, iOS, Web, Other messaging platforms |
This table outlines the key features and trade-offs of each tool. For businesses looking to manage costs, Firebase Analytics stands out as a free option with robust features. Meanwhile, Mixpanel offers advanced segmentation and funnel analysis starting at $25/month, a feature set that helped one SaaS productivity app improve setup completion rates from 40% to 75%.
UXCam is particularly useful when you need qualitative insights, such as session replays and heatmaps, to understand how users interact with your app. This complements the quantitative data provided by other tools, making it a great choice for improving interface design and user experience.
For engagement automation, CleverTap and Pushwoosh shine. CleverTap combines analytics with multi-channel messaging, earning high user ratings (4.5/5 on Capterra, 4.6/5 on G2). Pushwoosh, on the other hand, offers a user-friendly interface and real-time analytics, making it a flexible option for businesses focused on messaging.
All these tools support Android, with additional coverage for iOS and Web platforms. This ensures consistent retention tracking across multiple user touchpoints. Use this comparison to find the tool that aligns with your specific Android retention goals.
Conclusion
Selecting the right retention tool can transform first-time users into long-term customers. With the U.S. app market becoming increasingly competitive and user acquisition costs on the rise, prioritizing retention is more crucial than ever. Tools like Firebase Analytics are a great starting point, offering a free tier and seamless Android integration. For more advanced needs, Mixpanel shines with its cohort analysis capabilities - one SaaS productivity app used it to boost setup completion rates from 40% to 75%. If your team values visual insights, UXCam provides session replays and heatmaps to uncover the "why" behind user behavior.
Every app has unique requirements, and the right tool should align with your specific goals. For instance, a U.S. e-commerce app leveraged CleverTap to segment users based on their purchase activity and send personalized push notifications, resulting in an 18% increase in 30-day retention.
Keep in mind that retention tracking isn’t a one-and-done task. Regularly analyzing cohorts, running A/B tests, and fine-tuning strategies are essential to staying competitive. Whether you're a startup exploring Firebase’s free tier or an enterprise maximizing CleverTap’s segmentation features, the ultimate goal is the same: understanding your users and keeping them engaged.
For more resources to refine your retention strategy, check out the Marketing Analytics Tools Directory at https://topanalyticstools.com. This platform categorizes top analytics tools, helping you compare solutions for real-time insights, audience analysis, and business intelligence - empowering you to make data-driven decisions to improve your Android app's retention.
FAQs
What should I look for in a retention tracking tool for my Android app?
When choosing a retention tracking tool for your Android app, it's important to weigh a few key factors to find the right fit for your needs. Ease of integration should be at the top of your list - opt for tools that provide SDKs or APIs tailored for Android to simplify the setup process.
Another crucial aspect is data accuracy and real-time tracking. This ensures you can reliably monitor user behavior and retention trends as they happen, giving you a clear picture of how your app is performing.
Don't overlook the importance of reporting and visualization features. Tools with intuitive, customizable dashboards make it easier to spot trends and act on insights quickly. Lastly, consider the tool's scalability - you'll want a solution that can handle your app's growth, whether that means more users or expanded functionality. Focusing on these elements will help you select a tool that aligns with your app's goals.
What are the key differences between Firebase Analytics and Mixpanel when it comes to cohort analysis and tracking user retention?
When it comes to cohort analysis and tracking user retention, both Firebase Analytics and Mixpanel bring valuable tools to the table. However, their strengths lie in different areas, catering to distinct needs.
Firebase Analytics, a part of Google's ecosystem, stands out for its seamless integration with tools like Google Ads and BigQuery. It uses event-based tracking to help you monitor user behavior over time and provides predefined reports to measure retention rates. This makes it an excellent option for developers looking for a free and scalable solution that fits into the Google suite.
Mixpanel, on the other hand, focuses heavily on advanced analytics, particularly in user segmentation and behavioral insights. It offers greater flexibility and customization for creating cohorts and analyzing retention, making it a strong choice for businesses aiming to dive deeper into user actions and trends.
Ultimately, the right choice depends on your goals. If you need straightforward tracking with easy integration into other Google tools, Firebase Analytics is a solid pick. If your priority is detailed, customizable insights, Mixpanel delivers the depth you’re looking for.
What makes UXCam better at analyzing user behavior compared to standard analytics tools?
UXCam stands out when it comes to understanding user behavior, thanks to its focus on visual insights and session replay features. Instead of just relying on numbers and charts like traditional analytics tools, UXCam lets you actually watch recordings of user sessions. This gives you a front-row seat to see exactly how users interact with your app in real time.
On top of that, UXCam offers heatmaps, which highlight areas where users are most engaged or where they might be running into trouble. These insights make it easier to spot design or usability issues that need attention. By combining both qualitative data (like session replays) and quantitative data (like heatmaps), UXCam becomes a powerful ally in refining user experiences and boosting retention for Android apps.