If your API slows down, the database is often the reason - even when uptime still shows 100%.
I’d track 10 database metrics together to catch trouble early: query latency, lock waits and deadlocks, cache hit rate, database error rate, replication lag, write throughput, read throughput and query volume, connection utilization, disk I/O, and resource saturation. The point is simple: API SLOs tell me that users are feeling pain, while database metrics tell me what is causing it.
A few numbers make the case:
- APIs handle about 83% of global web traffic
- Unplanned database downtime can cost $14,056 per minute
- Tail latency - especially p95 and p99 - matters more than averages
- A database can be "up" and still serve stale data, queue requests, or time out under load
Here’s the short version of what I’d watch first:
- Start with: query latency, error rate, replication lag
- Then check cause: locks, cache misses, throughput, connections, disk, CPU/memory
- Set alerts by user impact: stale reads, timeouts, failed writes, and slow endpoints
- Break metrics out by endpoint, tenant, table, and node: cluster averages can hide local failures
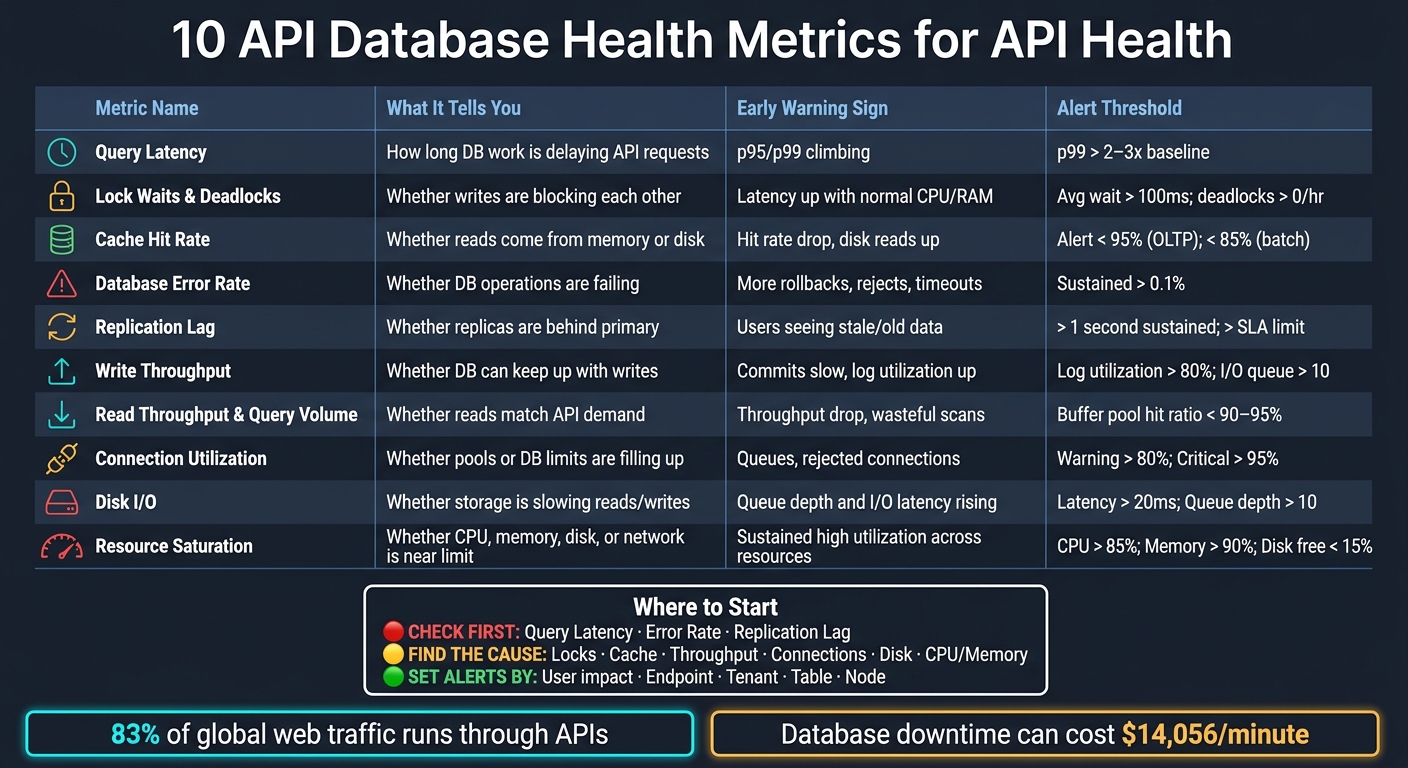
10 API Database Health Metrics: What to Watch & When to Alert
Quick comparison
| Metric | What it tells me | Early warning sign |
|---|---|---|
| Query latency | How long DB work is delaying API requests | p95/p99 climbing |
| Lock waits and deadlocks | Whether writes are blocking each other | Latency up with normal CPU/RAM |
| Cache hit rate | Whether reads come from memory or disk | Hit rate drop, disk reads up |
| Database error rate | Whether DB work is failing | More rollbacks, rejects, timeouts |
| Replication lag | Whether replicas are behind | Users seeing old data |
| Write throughput | Whether DB can keep up with writes | Commits slow, log use up |
| Read throughput and query volume | Whether reads match demand well | Throughput drop, wasteful scans |
| Connection utilization | Whether pools or DB limits are filling up | Queues, rejected connections |
| Disk I/O | Whether storage is slowing reads/writes | Queue depth and I/O latency up |
| Resource saturation | Whether CPU, memory, disk, or network is near limit | Sustained high utilization |
If I want a fast read on database health, I don’t look at one chart. I look at the pattern across these 10 metrics and line them up with API latency, errors, and data age.
sbb-itb-5174ba0
Why API Workloads Put More Pressure on Databases
API-driven systems put uneven pressure on databases. In microservices setups, hundreds of separate services talk through APIs, and one request can kick off several downstream queries across those services [7].
Bursty Traffic and Fan-Out Queries
API traffic often fans out into many downstream queries, so one slow query can spread delay across services [7]. A marketing campaign can drive a 300% jump in online banking queries, creating sharp bursts that push database concurrency hard [3].
That fan-out explains why latency, locks, and connection pressure often climb at the same time.
Read-Heavy, Write-Heavy, and Mixed API Behavior
Different APIs strain a database in different ways. A real-time analytics endpoint is mostly read-heavy, which puts pressure on caching and replication. A write-heavy API puts more strain on locking, transaction throughput, and disk I/O. Many production systems combine online transactions with heavy real-time analytics, and that mix creates resource contention that cuts throughput [1].
The bottleneck shifts with the workload. Read-heavy APIs tend to expose cache and replication problems. Write-heavy APIs tend to expose lock contention and disk pressure.
The next metrics show how those failure patterns show up in production.
Why One Metric Never Explains the Full Problem
One bad query, lock, or maxed-out pool can affect thousands of API requests. CPU and RAM may look fine while the database is under strain - lock contention or disk I/O wait can still lead to multi-second API latency [8]. Connection pool exhaustion can also look like database slowness, but the cause is often on the application side - code opens connections and never closes them [2][3].
One metric almost never explains an API failure. The pattern shows up across latency, contention, freshness, and saturation.
The 10 metrics below tie those pressure points to early warning signals.
1. Query Latency
Query latency is the time an API request spends waiting on the database. Teams usually track it as response time in milliseconds (ms) [1][7]. When it starts climbing, the main job is to figure out why - contention, caching problems, or system saturation.
Skip averages for this. Watch p95 and p99 instead, because tail latency is where sporadic problems tend to show up, like lock contention or batch jobs running at the wrong time [6][7].
When tail latency goes up, the usual suspects are pretty familiar: missing indexes, bad joins, lock contention, or stale statistics that push the optimizer into weak execution plans [1][10]. Traffic spikes can make all of this worse and drain connection pools [10]. In many cases, error spikes show up right after latency and contention start moving up.
Break latency out by endpoint, query type, and tenant so you can see which slowdowns users are actually feeling [7]. Organizations using optimized monitoring strategies have reported up to a 42% reduction in query execution time [6]. If latency rises alongside lock waits, the issue is likely contention. If it climbs with cache misses or I/O, look somewhere else for the bottleneck.
2. Lock Waits and Deadlocks
Lock waits tell you how long one transaction sits around waiting for a lock held by another. Deadlocks are worse: two or more transactions block each other in a loop, so the database has to kill one to break the stalemate.
If latency goes up and CPU and memory look normal, check lock waits and deadlocks next. This is a common trap. The app gets slower, users feel it, but the infra charts look fine. In many cases, the bottleneck is lock contention. You’ll often see it during high-concurrency writes - for example, multiple POST or PUT requests hitting the same records at once. Another common case is a long-running analytics query that locks a table that transactional endpoints also need.
For OLTP workloads, keep average lock wait time under 100 ms and deadlocks at 0 per hour. Treat any deadlock as critical.
The pattern is usually pretty clear once you know what to look for. Query latency climbs without a matching CPU or memory jump. Lock timeout errors start showing up in logs. Users hit timeouts on checkout, transfer, or update requests. When that happens, find the blocking session before you start tuning capacity. A blocked set of transactions can drain the connection pool fast.
| Metric | Healthy Target (OLTP) | First Degradation Signal |
|---|---|---|
| Avg Lock Wait Time | < 100 ms | API response-time spikes; lock timeout errors |
| Deadlock Count | 0 per hour | Transaction rollbacks and 500-level HTTP errors [11] |
Use db2pd or pg_stat_activity to find the blocking SQL statement and session. Fix the blocker first.
If lock metrics stay clean, the next place to check is cache efficiency.
3. Cache Hit Rate
If lock waits and deadlocks are flat, look at cache misses next.
Cache hit rate is the share of data requests your database serves from memory instead of disk. The formula is simple: Hits / (Hits + Misses). A hit means the data was already in memory. A miss means the system had to pull it from slower storage. When hit rate drops, disk reads go up. In practice, that tends to show up first as slower API response times, not just weaker database performance.
For read-heavy and OLTP workloads, aim for 97%+ and alert at 93%. For mixed and batch workloads, the floor is lower - around 90% - but a sudden move from 98% to 91% is still a meaningful warning, not random noise [3].
Track this at 2 layers:
- Application cache - such as Redis keyspace hits and misses
- Database buffer pool - such as PostgreSQL shared buffers or DB2 buffer pools
That comparison helps you pinpoint the problem. If the app cache drops but the database buffer pool holds steady, the issue is likely in the app layer. If both fall at the same time, the usual cause is memory pressure or a workload shift.
When hit rate starts slipping, the common reasons are a working set that no longer fits in memory, data expiring too fast, or bursty traffic mixed with low-reuse queries [12]. If the drop happens alongside higher disk I/O and more active connections, the pattern is pretty clear.
| Workload Type | Healthy Target | Warning Threshold | Critical Threshold |
|---|---|---|---|
| Read-Heavy API | 97%–99%+ | 95% | 93% |
| Mixed/OLTP | 95%–98% | 92% | 90% |
| Batch/Analytics | 90%–95% | 85% | 80% |
Investigate by query pattern, not just the global average. One low-reuse query type can distort the total [6].
4. Database Error Rate
Database error rate tells you when API requests are failing at the data layer - failed queries, rollbacks, and rejected connections - measured as a share of total operations or as errors per minute [1][7].
Keep the rate below 0.1%. Set an alert for any sustained move above baseline, not just sharp spikes. Batch windows can hide trouble that only shows up under peak traffic [4][5].
Don’t stop at total error volume. Break errors out by class. A connection rejection points you in one direction; a constraint violation or lock timeout points you somewhere else entirely [1][6].
Use the error class to cut to the cause fast.
| Error Class | Likely Cause | First Check |
|---|---|---|
| Connection rejections | Pool exhaustion or maxclients misconfiguration |
Connection utilization metrics |
| Lock timeouts / deadlocks | Concurrent write contention | Lock wait counts by table |
| Constraint violations | Schema mismatch or bad application logic | Query logs by endpoint |
| Transaction rollbacks | Resource exhaustion or replication/sync issues | Transaction logs and replication health |
Match database errors against HTTP 4xx and 5xx so you can separate application failures from infrastructure issues [5].
Also watch net.rejectedConnectionsPerSecond, db.syncPartialErr, and rising query execution times. Those often show up before the main error rate moves in a big way [2][12].
If errors climb and you don’t see a lock or capacity pattern, check replication lag next.
5. Replication Lag
If API errors stay low but users are seeing old data, check replication lag next. Replication lag is the delay between a write hitting the primary database and that same write showing up on replicas. It’s measured in milliseconds or seconds. This shows up fast in APIs that read from replicas - a user submits a form, the write succeeds on the primary, then the next API call lands on a replica that hasn’t caught up and returns the old state [2].
For user-facing APIs, aim for subsecond lag. Your alert threshold should line up with your freshness SLO. If a payment API can only tolerate data that’s up to 5 seconds old, set the critical alert at 4 seconds. Also watch for lag that keeps climbing for 5 to 15 minutes without dropping back down [13].
Once lag starts, look at 2 things: how fast it’s growing and whether replicas are still keeping pace.
| Signal | Healthy State | Warning Sign |
|---|---|---|
| Replication lag (time) | < 1 second | Sustained growth over 5+ minutes |
| Replica sync errors | 0 | Any increase |
If lag is going up, start with replica disk write latency and network throughput. Those are the most common causes when replicas fall behind the primary and stale API reads start showing up [13].
6. Write Throughput
After you check replication lag, look at the write path itself. If writes are slowing down or piling up, users will feel it fast.
Write throughput measures how many inserts, updates, and deletes the database handles in a set time window. Track it as TPS or rows per second.
Watch write demand at the API layer and write volume at the database layer. That comparison helps you catch gaps early. If incoming write demand is higher than what the database can process, you’ll usually see retries, queueing, or stalled commits. To users, that shows up as failed or delayed requests.
Baseline write throughput by workload window. Use separate baselines for each workload pattern before setting thresholds.
The main warning signs stay fairly consistent across workloads:
- A sudden drop in write commands per second often means slow writes are cutting throughput [12]
- Disk I/O queue depth above 10 points to storage saturation [4]
- Transaction log utilization above 80% signals a higher risk of write stalls [3]
| Write Signal | Warning Threshold | Likely Cause |
|---|---|---|
| Write commands per second | Sudden or sustained decline | Slow writes reducing throughput [12] |
| Disk I/O queue depth | > 10 | Storage saturation [4] |
| Transaction log utilization | > 80% | High write volume or slow log archiving [3] |
| Commit latency | Sustained increase in ms | Over-indexing, slow disk I/O, or large transaction sizes [10][4] |
If write throughput falls while latency climbs, start with lock contention and slow disk I/O. Read write throughput alongside latency and lock metrics so you can tell whether the issue is contention or storage pressure.
7. Read Throughput and Query Volume
Read throughput tells you if the database can keep pace with API demand. After write throughput, this is the next metric to watch. Track it as QPS, then break it down by endpoint, table, tenant, and workload. That gives you a direct view of whether the database can serve API requests in real time, which is a key data quality KPI for performance monitoring.[1][6]
Raw read throughput, though, only tells part of the story. You also need to watch rows read per row returned. When that ratio gets high, the query is doing too much work to return too little data. In plain terms, that often means missing indexes or full table scans. Looking at the SQL statements with the worst ratios is one of the fastest ways to find queries worth fixing.[3][6]
After you understand query efficiency, switch to 1-minute sampling so you can catch short bursts that longer windows miss. Set separate baselines for each endpoint and workload. A search endpoint and a reporting job may both read heavily, but they should not be judged against the same baseline.[6]
These signals help you tell the difference between rising demand and waste inside the read path.
| Signal | Threshold | What It Suggests |
|---|---|---|
| Throughput drop + latency rise | Simultaneous occurrence | Database approaching a saturation point [12] |
| Rows read vs. rows returned ratio | High ratio | Inefficient queries, often from missing indexes or full table scans [3] |
| Buffer pool hit ratio falls | Below 90-95% | More disk reads are likely [3] |
| Sort overflow increase | Sustained rise above baseline | Read queries are spilling to disk [3] |
If throughput drops while demand stays flat, check cache hit rate and disk I/O latency before you blame traffic. If reads slow down and there is no demand spike, the next place to look is connection utilization and saturation.
8. Connection Utilization
When read traffic goes up, database connections often become the next constraint. Connection utilization shows how many open connections exist between your API and the database compared with the database's max connection limit. Track it 3 ways: the raw count of active connections, the percent of the max limit, and application-side pool usage. Fan-out patterns can burn through connection limits fast during traffic spikes. When that happens, requests start queueing, timeouts increase, and p95 latency climbs. In most cases, high utilization shows up as queued requests before it turns into a full outage.
Use 80% as a warning level and 95% as critical. If utilization stays above 85% for 10 minutes, treat that as saturation [3][4].
The failure signals here each point to a different issue. Active connections that keep rising and never fall back usually mean a connection leak: the API opens connections and does not close them. Connections open longer than 4 hours point to stuck worker processes or inefficient API logic [3]. Rejected connections at any non-zero count mean the database is already hitting its max connection limit [12].
| Signal | What It Indicates | Action |
|---|---|---|
| Sustained utilization > 85% | Pool approaching saturation | Review pool sizing and connection handling [3][4] |
| Connections never falling back | Likely connection leak in API code | Audit connection close logic per service [3] |
| Duration > 4 hours | Stuck worker process or inefficient API logic | Investigate the source [3] |
| Rejected connections > 0 | Max connection limit already being hit | Investigate immediately [12] |
Use this metric alongside lock waits and query latency to tell apart pool exhaustion and slow database work.
9. Disk I/O Latency and Throughput
If query latency is still high after you’ve checked locks, cache, and connections, look at storage and website analytics tools next. Disk I/O latency shows how long storage takes to finish a single read or write request, measured in milliseconds (ms). Disk throughput shows how much data moves per second, usually in MB/s or GB/s. IOPS counts how many read and write operations happen each second [4].
A sustained disk I/O latency above 20 ms is a common warning sign [4]. Disk queue depth - the number of I/O requests waiting to be served - often shows trouble first. If queue depth stays above 10, storage is often hitting its limit before users start to feel the delay [4].
The shape of the problem usually matches the workload. Read-heavy endpoints cause more physical reads when cache hit ratio falls. Write-heavy endpoints, including POST and PUT requests, push more disk writes. Batch jobs can also compete for the same disks and slow live API requests when they run at the same time as production traffic [1][3]. I/O wait means the CPU is waiting on disk, not doing compute work [1].
| Metric | Unit | Alert Threshold |
|---|---|---|
| Disk I/O Latency | ms | > 20 ms sustained [4] |
| Disk Queue Depth | Count | > 10 sustained [4] |
| Disk Throughput | MB/s | Sustained drop below baseline [4] |
| I/O Wait | % CPU time | Sustained spikes during API traffic [1] |
Use queue depth as the early warning. Latency tends to show up after the storage layer starts falling behind.
10. Resource Utilization and Saturation
If latency, locks, cache misses, or replication lag still don’t explain the slowdown, the database may just be running out of room.
Resource utilization measures CPU, memory, disk, and network use. Saturation begins when one of those gets close to capacity and requests start lining up. That’s usually when p95 climbs, and errors start to show up soon after.
These resource signals sit underneath many of the issues covered earlier. CPU, memory, disk, and network often drive the latency, lock, and cache patterns you’re seeing. One common chain looks like this: memory pressure -> cache misses -> more disk reads -> higher latency.
Use these thresholds to catch saturation before it spills into API errors.
| Resource | Unit | Alert Threshold |
|---|---|---|
| CPU Utilization | % | > 85% sustained for 10+ min [4] |
| Memory Usage | % | > 90% utilized [4] |
| Disk I/O Queue Depth | Count | > 10 [4] |
| Disk I/O Latency | ms | > 20 ms [4] |
| Disk Space | % free | < 15% free [4] |
| Network Interface | % | > 80% sustained [4] |
CPU climbing outside peak traffic often points to a runaway query that’s pushing the system into saturation. Memory that creeps up over several days can point to a workload shift that’s eating into headroom. The plain way to check it: line up resource metrics with slow query logs and see which workload is causing the pressure.
Next, match these resource spikes against query latency and error patterns to isolate the bottleneck.
How These Metrics Interact in Production
Use these metrics together to tell cause from symptom.
Cause-and-Effect Chains Across Database Metrics
Database metrics usually break in a chain, not one by one. That chain points to the root cause.
When a traffic spike hits, cache hit rate often drops if the surge pulls in data that is not already cached. The database then has to do more disk reads or other slower work, and query latency goes up [1][12]. As queries slow down, they hold connections for longer. That puts pressure on the pool. Once the pool is exhausted, the API starts returning errors.
The write path has its own pattern. High write throughput can outpace replication, so replicas start to fall behind and replication lag climbs [2][14]. At the same time, writes that compete for the same rows increase lock waits, which slows API transactions on those tables.
These are the production patterns that show up most often:
| Starting Signal | What It Drives Next | End Result |
|---|---|---|
| Read throughput spike | Cache hit rate drop | Higher query latency and connection exhaustion |
| Write throughput spike | Replication lag | Stale reads on user-facing endpoints |
| Concurrent writes | Lock waits | Slower API response times |
| Connection saturation | Timeouts | Higher database error rates |
Examples from API Transactions and Data Pipelines
A heavy ingestion run is a good example. Batch writes to the primary can push replication lag high enough that read replicas return outdated data, even when the write path looks healthy at first glance. In another common case, a traffic burst turns slow queries into pool exhaustion, and then into rejected requests.
How to Correlate Database Metrics with API Latency and Data Freshness
When query latency spikes, check cache hit rate and disk I/O in the same time window. If cache stays flat, the bottleneck is more likely in locking or inside the database engine. If cache drops first, the problem likely started with traffic or cache capacity [1][12].
For data freshness, compare replication lag against the timestamps on user-facing API responses. That helps you see when the gap opened and which write workload triggered it. Keep these signals in the same window so you can spot the first metric that moved. Once the sequence is clear, you can set alert thresholds based on user impact.
Alert Thresholds and Priority Levels
Averages miss the pain users feel. p95 and p99 show the slow end of the experience, and that’s where alerts should start. After you map how your metrics connect, the next move is simple: decide when an alert should fire and how much urgency it deserves.
Use Percentiles, Not Averages, to Set Thresholds
Set thresholds on p95 and p99, not averages, because tail latency is what users notice. If you already have a baseline, alert when p99 goes above 2-3x baseline instead of using a fixed cutoff [15]. That works better because normal latency looks different across systems and workloads.
To cut noise, require the metric to stay above the threshold for 5-10 minutes before paging someone [13]. That filters out short spikes that clear on their own. Use the same percentile-based approach for the other metrics in this list.
Rank Alerts by User Impact and Data Freshness
After thresholds are in place, priority should follow user impact. Connection pool exhaustion is critical. Replication lag that breaks your data-freshness SLA is also high priority - for example, more than 30 seconds on a near-real-time reporting endpoint - because stale reads can change downstream decisions without ever producing an error code [2][5].
A simple tier model helps keep the on-call team focused:
| Priority | Condition | Response Channel |
|---|---|---|
| Critical | Connection pool exhausted, offline DB partition, connection utilization > 95% of max [13][3] | Phone/SMS |
| High | Replication lag above SLA, sustained increase in 500-level status codes, p99 latency > 2-3x baseline [2][5][13] | PagerDuty/Slack |
| Warning | Cache hit ratio dropping, disk free space < 2 GB, connection utilization > 80% of max [3][12][13] | Slack/Teams |
| Informational | Capacity trend changes, baseline drift | Email/Logs |
Break Alerts Down by Endpoint, Tenant, Table, and Node
Cluster-wide averages can look fine while one part of the system is failing. Break alerts out by API endpoint to catch slow queries tied to a route, by tenant or service to spot connection issues early, by table to find lock contention in busy workloads, and by database node to catch uneven load or memory-starved replicas that spill into disk reads [1][9][12].
Those slices line up with the metrics already covered: query latency, lock waits, cache misses, replication lag, and saturation. The narrower the alert scope, the faster you can find the workload that’s causing the problem.
Applying These Metrics to API-Driven Analytics Workflows
These metrics don’t carry the same weight in every workflow. Dashboards, pipelines, and attribution jobs fail in different ways, so the first signals you watch should match the job at hand.
Real-Time Dashboards and Read-Heavy Analytics APIs
For dashboards, start with query latency, cache hit rate, read throughput, and replication lag. Those four usually tell you what’s going wrong before users start filing tickets.
Cache misses drag down dashboard queries. Replication lag hurts data freshness and can break SLAs. Track replication lag at all times, not just during peak traffic. A drop in cache hit rate is often the first red flag, showing up before latency gets worse.
Read-heavy analytics workloads tend to show freshness issues first. Write-heavy pipelines, on the other hand, tend to show contention and saturation first.
ETL, ELT, and Attribution Pipeline Reliability
Batch loads and attribution jobs put pressure on write paths, locks, and storage. Write throughput tells you whether the database is keeping up with incoming data. When it slips, backlogs grow and reporting windows start to move.
Lock waits often jump when a heavy batch job and a live read query both hit the same table. That’s a common source of slowdowns in mixed workloads.
You should also watch disk I/O and resource saturation. A large ELT job can max out CPU and memory, which then hurts concurrent real-time reads [1]. CDC can cut write pressure in near-real-time reporting.
Tools and Resources for Evaluating Analytics Platforms
When you’re checking analytics platforms, make sure the same health signals are visible in production - not just in a sales demo. At a minimum, look for:
- Query-level profiling
- OpenTelemetry support
- Visibility into replication lag
- Visibility into connection health
You can use the Marketing Analytics Tools Directory as a reference point.
Conclusion
The fastest high-level signals to check first
Start with query latency, error rate, and replication lag. Those 3 checks give you the fastest read on database health.
Query latency is often the first visible sign that the database is under strain. Error rate tells you if requests are failing in the data layer or somewhere around it in the stack. Replication lag shows whether read replicas are serving fresh data or data that has already gone stale.
The metrics that explain the cause
If any of those 3 shift, use the other metrics to find the bottleneck. Lock waits, cache hit rate, throughput, connection utilization, disk I/O, and resource saturation help explain what's driving the change.
Tie database health targets to API reliability and data timeliness
Set thresholds based on user impact and freshness SLAs. Teams that line up database targets with API SLOs can catch degradation before it turns into failure. Track the leading indicators, then use the supporting metrics to protect API reliability and data freshness.
FAQs
Which database metrics should I track first?
Start with the top-line metrics that tell you if the database is healthy: query response time, throughput, active connections, and error rates. Those numbers give you a fast read on performance, stability, and how close you are to concurrency limits.
Then track CPU, memory, and disk I/O, along with slow queries and lock wait times. That helps you tell the difference between infrastructure strain and database bottlenecks, and it gives you a chance to catch issues before users feel them.
Why do p95 and p99 matter more than averages?
p95 and p99 matter more than averages because they show the slowest requests users actually feel. They also point to growing resource pressure before average metrics start to look bad.
Averages can stay normal while a small slice of requests gets badly delayed. That’s where slowdowns, queueing, and timeouts start to show up. Rising tail percentiles often flag broker or database latency stress earlier than alerts based on averages alone.
How do I tell whether slowness is caused by locks, cache, or connections?
Compare related database health metrics to find the bottleneck:
- Rising lock wait time or contention means transactions are blocking each other.
- A lower cache hit ratio means more reads are falling back to slower storage.
- Poor connection or pool health means requests may queue or time out.
Check these next to query execution time, throughput, and query errors so you can see what’s driving the slowdown.