If I want an attribution dashboard that people will trust in 2026, I need 3 things first: clean IDs, fixed metric definitions, and one clear attribution model for default reporting. Without those, the dashboard may look polished, but the numbers will not hold up when I compare them with CRM, ad spend, or finance data.
I’d treat this as a revenue reporting system, not just a marketing report. The article makes 4 points clear:
- Scope comes first - I need to decide whether I’m reporting on leads, orders, accounts, pipeline, or closed-won revenue.
- Data quality decides trust - shared IDs, UTM rules, campaign naming, UTC timestamps, and join checks are what keep credit from breaking.
- Metrics need labels - I should label revenue type, attribution model, lookback window, and whether results are sourced or influenced.
- Governance keeps numbers stable - marketing, RevOps, finance, and data teams each need clear ownership for definitions, refreshes, reconciliations, and model changes.
A few points stand out fast:
- 57% of companies now use some form of marketing attribution
- Teams using data-driven attribution report 1.7x faster revenue growth
- Attribution shows credit allocation, not proof of lift
- A good dashboard should answer:
- what happened
- who influenced it
- what it earned
Here’s the short version of what I’d keep in mind:
| Area | What matters most |
|---|---|
| Scope | Lead funnel, ecommerce, or account-based journey |
| Data | CRM, website analytics tools, ad platforms, marketing automation, finance, offline activity |
| Checks | Missing campaign IDs, broken UTMs, duplicate records, weak lead-to-opportunity joins |
| Views | Executive, channel, campaign, funnel, account/opportunity |
| Models | First-touch, last-touch, linear, time-decay, position-based, W-shaped, data-driven |
| Labels | Revenue type, model, lookback window, time zone, cost basis |
| Ownership | Marketing, RevOps, finance, analytics/data engineering |
I’d also keep revenue buckets separate: pipeline, bookings, recognized revenue, and net revenue are not the same thing. Mixing them is one of the fastest ways to confuse decision-making.
The core takeaway is simple: an attribution dashboard works when it ties spend to revenue with clear rules, tested joins, and visible assumptions. Start with a small metric set - like spend, conversions, opportunities, closed-won revenue, attributed revenue, cost per opportunity, and ROAS - then add more only after one full reporting cycle matches CRM and finance.
Marketing Attribution Explained | Which Channel Actually Gets the Credit?
sbb-itb-5174ba0
Data and Tracking Requirements for Reliable Attribution
Reliable attribution starts with clean joins, shared IDs, and tight campaign naming. If those basics slip, the dashboard stops being a source of truth and turns into a cleanup project.
Core Data Sources and the Fields Each One Contributes
| Data source | Key fields contributed | Dashboard views supported | Common data-quality KPIs |
|---|---|---|---|
| Website analytics | User or session ID, first-touch and session source, medium, campaign, landing page, conversion event, timestamp, device, geography | Traffic, engagement, first-touch, last-touch, conversion-path views | Missing UTMs, consent gaps, cross-domain breaks, duplicate events |
| Advertising platforms | Platform campaign ID, ad group or ad set ID, creative ID, impressions, clicks, spend, reach, dates, audience, placements | Paid-channel, campaign, creative, spend, and ROAS views | Spend delays, mismatched campaign names, currency and time zone differences, deleted campaigns |
| Marketing automation | Lead ID, contact ID, form submission, email engagement, nurture membership, lead score, lifecycle stage, campaign membership, timestamps | Lead-generation, nurture, engagement, and marketing-sourced pipeline views | Duplicate contacts, overwritten source fields, inconsistent lifecycle updates, missing campaign membership |
| CRM | Lead and contact IDs, account ID, opportunity ID, contact roles, campaign membership, opportunity stage, amount, close date, owner, lead source, primary campaign source | Funnel, pipeline, account, opportunity, sourced-pipeline, and revenue views | Unassigned contact roles, stale stages, missing close dates, duplicate records, incomplete campaign associations |
| Email platform | Send, delivery, open, click, unsubscribe, bounce, message ID, recipient ID, campaign ID, send date | Email engagement, conversion, deliverability, and campaign views | Privacy-related open-rate distortion, inconsistent recipient IDs, untracked links, suppression-list mismatches |
| Webinar platform | Registration ID, attendee ID, attendance status, duration, event ID, session, engagement, date | Webinar-sourced leads, engagement, pipeline, and event ROI views | Unmatched CRM contacts, late attendance files, duplicate registrations |
| Events and field marketing | Event ID, attendee or badge ID, session, scan timestamp, location, cost, membership status, influenced opportunity | Event performance, regional, account, and pipeline views | Manual imports, duplicate attendees, missing costs, unclear attendance definitions |
| Offline sales activity | Call, meeting, direct-mail, sales-activity ID, rep, account, contact, date, outcome, cost | Account-based, sales-assisted, and multi-touch journey views | Unlogged activity, manually entered dates, weak contact-to-account matching |
| Partners and referrals | Partner ID, referral ID, source, referred account or contact, referral date, status, commission or cost | Partner-sourced pipeline, revenue, and partner ROI views | Unclear ownership, duplicate referrals, missing referral IDs, inconsistent partner naming |
| Ecommerce or subscription billing | Order or subscription ID, customer ID, product, quantity, gross revenue, discount, tax, refund, net revenue, transaction date, subscription start and cancellation dates | Revenue, CAC, LTV, cohort, retention, and efficiency views | Gross-versus-net confusion, late refunds, renewals counted as new sales |
The biggest design call is identity mapping. You need one shared record that ties browser ID, lead ID, contact ID, and email ID back to the same person. Without that, one person can show up as several records across systems, and revenue gets overstated fast.
These fields decide which joins the dashboard can trust and which ones it can't.
Tracking Standards That Prevent Broken Reporting
Use complete UTM tagging and one canonical campaign ID across ad platforms, analytics, CRM, and finance. Keep values lowercase, use approved naming, and stick to one delimiter. If paid-social, paid_social, and Paid Social all exist at once, channel rollups fall apart. This is why using top social media analytics tools to standardize tracking across platforms is essential. For cross-system joins, use the canonical campaign ID, not campaign names by themselves.
Write the business rules down before the dashboard goes live. Be plain about:
- what counts as campaign membership - exposure, registration, attendance, click, or form completion
- what makes a contact an MQL
- which contacts are allowed to influence an opportunity
- whether "revenue" means gross bookings, recognized revenue, or net after refunds
If required deal fields are missing, those records fall out of attribution. That's not a reporting issue. It's a rules issue.
Time handling needs the same discipline. Store immutable event timestamps in UTC. Keep the source-system timestamp and time zone in separate fields so late-arriving data is easy to spot. Then choose one business reporting time zone, such as America/New_York, for daily rollups. Show dates in U.S. format, like September 28, 2026, and set one weekly reporting window - either Sunday-Saturday or Monday-Sunday. Small cutoff differences between ad platforms, CRM, and finance can create very real reporting gaps.
Once naming, IDs, and timestamps are locked down, the next job is to test the joins before anyone starts reading the dashboard.
Validation Checks That Catch Unattributed Revenue and Bad Joins
Broken joins lead to unattributed revenue or double-counted revenue. The fix is simple in theory: run automated checks on every refresh and catch issues before they hit a stakeholder report.
Check for missing campaign IDs on paid clicks, landing-page sessions, form submissions, and campaign members. Watch for broken or inconsistent UTMs, including uppercase variants, malformed URLs, unknown mediums, and campaign IDs missing from the campaign dictionary. Monitor low campaign-to-opportunity match rates, duplicate contact, lead, account, opportunity, order, or transaction records, and unreconciled spend between platform exports and the warehouse.
Also test join coverage from leads to contacts, contacts to accounts, contacts to opportunities, and opportunities to at least one qualifying campaign. Review date integrity, like future-dated transactions or close dates that come before create dates. Add null and validity checks for amount, currency, stage, close date, campaign ID, source, and medium. Measure attribution completeness across credited, uncredited, and over-credited revenue, and confirm spend completeness against platform exports or invoices.
Keep pipeline, bookings, recognized revenue, and net revenue separate. They are not interchangeable. Set alerts for week-over-week shifts in unattributed paid sessions and campaign-to-opportunity match rates.
Once the data clears those checks, the dashboard is ready for metrics and views.
Metrics and Views for Channel, Campaign, and Revenue Reporting
Once your data is validated, attribution dashboards built with top analytics tools should answer 3 plain questions: what happened, who influenced it, and what it earned.
Core Metrics by Stage: Engagement, Funnel Progression, Revenue, and Efficiency
Use metrics that fit the decision you need to make. Then roll them into channel, campaign, funnel, and account views.
| Stage | Metrics | Primary decision |
|---|---|---|
| Engagement | Impressions, reach, clicks, click-through rate (CTR), video completion rate, sessions, engaged sessions | Is the audience being reached and responding? |
| Funnel progression | Leads, marketing-qualified leads (MQLs), sales-qualified leads (SQLs), opportunities, conversion rates, pipeline created, sales-cycle duration | Are interactions turning into real opportunities? |
| Revenue | Closed-won deals, orders, bookings, recognized revenue, average order value, annual recurring revenue (ARR), customer lifetime value (LTV) | What commercial outcomes did marketing contribute to? |
| Efficiency | Cost per click (CPC), cost per lead, customer acquisition cost (CAC), return on ad spend (ROAS), pipeline-to-spend ratio, payback period, LTV:CAC | Are those outcomes worth the cost? |
Define every metric inside the dashboard. That includes revenue type, attribution model, and lookback window. Put the revenue type next to every figure so no one has to guess what they’re looking at. Also keep conversion counts separate from revenue credit by channel or other dimension, because those answer different business questions.[3]
The Key Dashboard Views: Executive, Channel, Campaign, Funnel, and Account
Use the same definitions in every view. If a revenue figure appears in 2 places, it should mean the same thing in both.
The executive view should answer 4 things fast: how much revenue came in, which sources helped drive it, how much it cost to acquire, and what changed versus the prior period. Keep top-of-funnel engagement stats in drill-downs, not on the main screen. The main view should show revenue, pipeline, new customers, CAC, LTV:CAC, payback period, ROAS, and period-over-period change. Add a model toggle so teams can compare attribution models side by side.[4]
The channel view compares Paid Search, Organic Search, Paid Social, Organic Social, Email, Referral, Events, Partner, Direct, and Sales Outreach using the same rules across the board. Show channel performance under one attribution model at a time, and include an unattributed row.[4]
The campaign view goes one level deeper, from channel totals into named programs. Say a Q3 Mid-Market Security Webinar campaign had $18,000 in spend, 240 leads, 72 MQLs, 18 opportunities, $360,000 in pipeline, and $96,000 in closed-won revenue. That gives you a pipeline-to-spend ratio of 20:1 and a last-touch ROAS of 5.3.
The funnel view should show both stage volume and movement through stages: visitor or session → lead → MQL → SQL → opportunity → closed-won. For each step, show conversion rate, median days in stage, and a channel or segment breakdown. This is where teams spot where attributed demand enters the funnel, where it stalls, and where it turns into revenue.[5] You might find, for example, that Paid Social drives a lot of leads but few opportunities, while partner referrals drive fewer leads with a much higher opportunity-to-win rate.
The account or opportunity view matters most in B2B because it ties marketing activity back to a specific CRM record. Show first-touch source, lead-creation source, opportunity-creation source, all eligible touches inside the lookback window, and model-specific credit by channel and campaign. Flag missing IDs, missing amounts, or broken campaign links.[6][7]
Make the drill-down path obvious: companywide total → business unit or region → channel → campaign → account or opportunity → contact and touchpoint timeline. That path gives executives a top-level read first, while marketing, sales, and finance can trace the number back to the underlying record without asking for a separate data pull.
Filters and Labels That Make Dashboards Usable and Comparable
Dashboards only stay comparable if every view uses the same controls and labels. Set shared filters for date, geography, segment, product, channel, campaign, stage, owner, customer status, model, lookback window, and revenue type.
Labels matter just as much. Every view should show:
- which time zone the dates use
- whether revenue is gross or net, and booked or recognized
- whether costs include media only or fully loaded sales and marketing costs
- whether the data is complete through the selected date
Normalize channel labels into one controlled taxonomy, and keep the original platform value in a separate field.[9]
The table below shows how reporting needs change by role. That’s why filter defaults and visible metrics should vary by audience.
| Role | Primary need | Essential metrics | Typical decision |
|---|---|---|---|
| Executive | Growth and efficiency | Revenue, pipeline, new customers, CAC, LTV:CAC, payback, targets | Approve investment, assess growth |
| Marketing | Channel and campaign optimization | Impressions, clicks, leads, MQLs, pipeline, attributed revenue, spend, ROAS, CAC | Reallocate budget, improve campaigns |
| Sales | Pipeline quality | MQL-to-SQL rate, opportunity creation, stage conversion, win rate, velocity | Prioritize accounts, improve conversion |
| Finance | Reconciliation and forecast | Bookings, recognized revenue, pipeline, forecast, cost basis | Reconcile actuals, validate assumptions |
| Operations | Data health | Match rates, missing values, unattributed sessions, refresh timestamps | Catch issues before they reach stakeholders |
Show the active filters in a clear, easy-to-see spot. If people miss the filters, they’ll read the wrong story from the same dashboard.
Attribution Models and How to Interpret Them
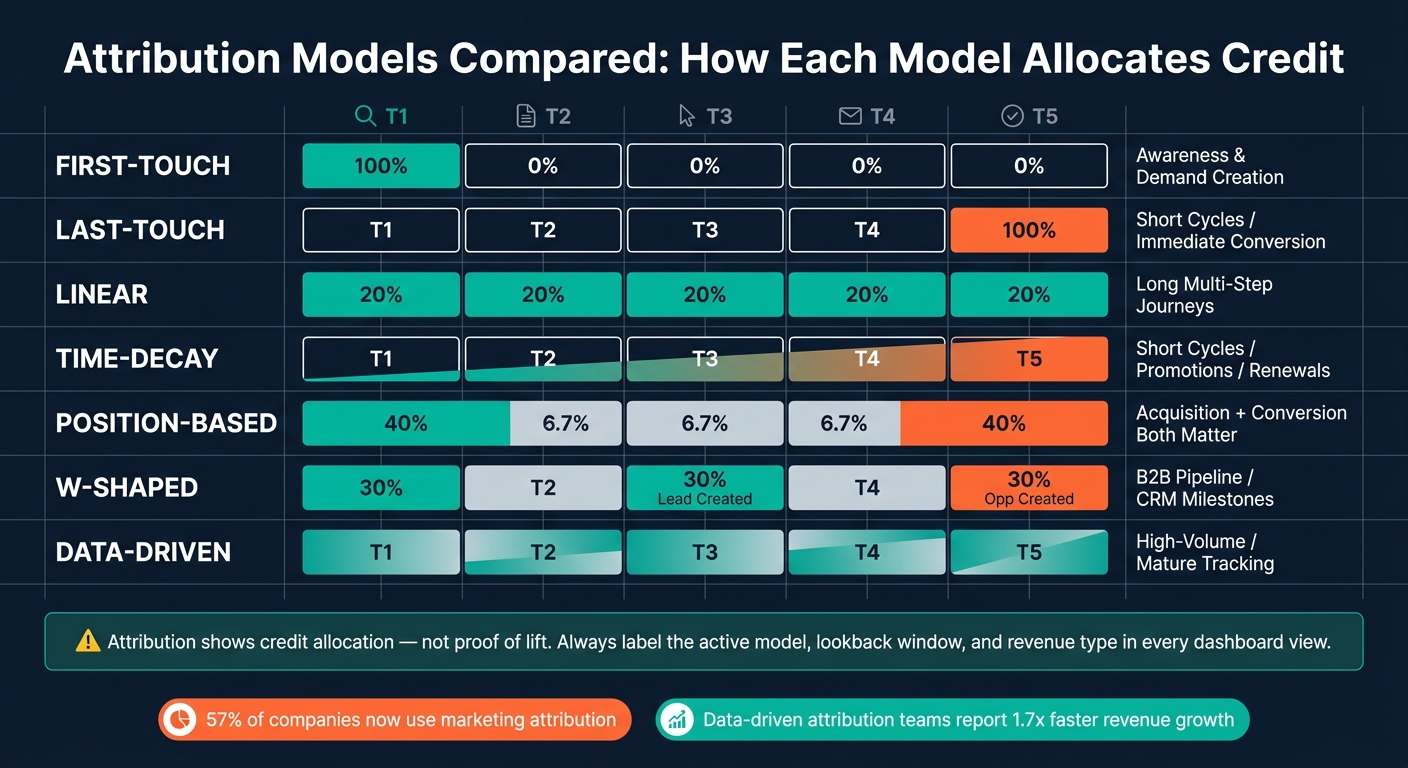
Attribution Models Compared: How Each Model Allocates Credit Across the Customer Journey
Once your analytics tools and resources are set, the next call is simple: how does each touch get credit? An attribution model is the rule that splits conversion, pipeline, or revenue credit across the touchpoints in a customer journey.[8] Change the model, and your channel rankings can move fast. The exact same journey might put paid social at the top in a first-touch model and branded search at the top in a last-touch model.
That’s why attribution models should explain credit allocation, not causality. In every view - executive, channel, campaign, and account - show the active model, conversion event, attribution window, lookback window, eligible touches, and revenue definition.
Attribution assigns credit to observed conversions. Keep attributed revenue, observed revenue, and incremental revenue in separate fields when incremental estimates exist. Never label attributed revenue as revenue generated.
How Each Attribution Model Works: First-Touch, Last-Touch, Linear, Time-Decay, Position-Based, W-Shaped, and Data-Driven
Each model applies a different weighting rule to the journey. In practice, it’s best to use one model for standard reporting and compare models only when channel rank itself affects budget or planning.
| Model | Logic | Use case | Strength | Interpretation risk |
|---|---|---|---|---|
| First-touch | Assigns 100% of credit to the first recorded interaction.[1][14] | Evaluating awareness and demand creation | Highlights acquisition channels | Ignores nurture and close-stage touches. |
| Last-touch | Assigns 100% of credit to the final recorded interaction before conversion.[1][14] | Short purchase cycles or immediate conversion analysis | Easy to explain; shows what closed the deal | Overweights branded search, retargeting, and direct traffic. |
| Linear | Splits credit equally across all eligible touchpoints.[1][14] | Long, multi-step journeys | Includes the full recorded path | Assumes every touch contributes equally |
| Time-decay | Gives more credit to touchpoints closer to conversion.[1][14] | Short cycles, promotions, or renewals | Reflects recency and closing momentum | Systematically undervalues early awareness |
| Position-based | Gives greater weight to selected positions - commonly 40% to the first touch, 40% to the last touch, and 20% to middle touches.[12] | Journeys where both acquisition and conversion matter | Recognizes both the opener and the closer | Weights are arbitrary. |
| W-shaped | Commonly assigns 30% each to the first interaction, lead creation, and opportunity creation, with the remaining 10% divided across other touches.[2][10] | B2B pipeline reporting tied to CRM milestones | Connects touches to funnel stages | Breaks when CRM milestone dates are missing, duplicated, reassigned, or defined differently across teams |
| Data-driven | Uses historical path data and an algorithm to estimate each interaction's contribution.[11] | High-volume programs with mature tracking | Can capture patterns fixed rules miss | Opaque and not causal proof. |
Some platforms no longer compute these models natively, so document where each model is calculated.
When to Compare Models Instead of Relying on One View
Compare models when channel rankings shape budget decisions, when the journey stretches across many sessions and channels, or when sales and marketing disagree about who should get credit. A sensitivity view helps here. Show each channel’s attributed revenue, conversion count, ROAS, and share of total credit under first-touch, last-touch, linear, position-based, W-shaped, and data-driven models. That makes it easy to spot which channels stay near the top no matter the model and which ones swing hard.
Big rank shifts usually tell you something useful. A channel that climbs in first-touch may be introducing prospects. A channel that wins in last-touch may be helping close. That’s a signal to test before you cut budget or add more spend.[13]
Keep a separate field for customer-reported source. It can pick up untracked exposure and word-of-mouth, but recall bias means it should support tracked attribution, not replace it. Any model change should sit inside governance, along with refresh and reconciliation rules.
Governance, Readiness, and Final Checklist
Who Owns Definitions, Refreshes, Reconciliations, and Model Changes
After you pick a model, governance is what keeps attribution steady from one refresh and reporting cycle to the next. Without clear ownership, an attribution dashboard falls apart fast. Definitions drift, taxonomies crack, and people stop trusting the numbers. The fix is simple: set a cross-functional responsibility matrix with one owner for each decision area and clear contributors, so channel credit, campaign credit, and revenue totals stay comparable.[15][16]
Marketing owns campaign taxonomy, channel naming, UTM standards, and media-platform mappings. Sales or RevOps owns lifecycle stages, lead and opportunity definitions, routing rules, account matching, and funnel-entry criteria. Finance validates approved spend, bookings, recognized revenue, refunds, cancellations, and the fiscal calendar. Analytics or data engineering owns ingestion pipelines, transformations, identity resolution, refreshes, dashboard calculations, access controls, and automated quality checks. A marketing analytics or BI lead should own dashboard release and change control.[15][16]
Cadence turns ownership into control. Split day-to-day monitoring from management reporting. That’s what protects the numbers people use to make channel, campaign, and revenue calls.
- Daily or near real-time: review pipeline freshness, spend pacing, and ledger variance.
- Weekly: review channel and campaign pacing, spend, lead quality, opportunity creation, and material variances with marketing and RevOps.
- Monthly: reconcile platform spend with finance-approved spend, compare CRM opportunities and revenue with the dashboard, review model or taxonomy changes, and publish a locked channel, campaign, and revenue reporting view for management.
- Quarterly: check whether attribution assumptions still fit the buying cycle, audit channel and campaign mappings, review model comparisons, assess incrementality or lift evidence where available, and approve changes to definitions or lookback windows.
Lock prior periods after the agreed close process, while keeping a documented restatement process for corrections.[17][18][19]
A compact data-health panel should track data freshness, unattributed conversion rate, duplicate rate, spend reconciliation variance, and pipeline ingest status. Set thresholds before launch. For example, flag a source when the latest load is more than 24 hours late, when unattributed conversions go above the agreed baseline, when duplicate conversion IDs show up, or when dashboard spend passes the agreed threshold against the finance ledger. If platform-reported conversions exceed CRM actuals by more than about 10% to 15% for the same period and conversion definition, investigate the gap. Still, set that threshold to fit your business and tracking method.[17]
Any model or formula change needs a change log entry that records the change, rationale, affected date range, expected impact, approver, test result, deployment date, and whether prior periods were restated. Never silently overwrite historical attribution results.[19]
Attribution Dashboard Readiness Checklist and Key Takeaways
Before you go live, work through this checklist.[19] Skip one of these items, and it will usually come back later as either a data-quality issue or a trust issue with stakeholders.
| Area | What to confirm |
|---|---|
| Goals, scope, and definitions | Documented business goal, reporting scope, conversion event, attribution window, primary audience, metric dictionary, grain, owner, refresh schedule, and inclusion/exclusion rules |
| Taxonomy | Controlled campaign and channel naming with conventions, UTM standards, and named owners |
| Connections | Working web, ad-platform, CRM, offline-conversion, and spend integrations |
| Identifiers | Stable IDs for contacts, accounts, opportunities, transactions, campaigns, and conversion events |
| CRM rules | Stage history and handling for reopens, cancellations, refunds, and duplicate opportunities |
| Finance rules | Currency, fiscal periods, booked versus recognized revenue, and spend reconciliation approach |
| Model labeling | Visible model, lookback window, conversion event, date basis, and revenue type |
| Formulas | Tested conversion rates, pipeline, revenue, cost per acquisition, and ROAS calculations |
| Quality checks | Automated alerts for freshness, completeness, duplicates, invalid joins, unattributed conversions, and spend variance |
| Drill-downs | End-to-end drill-down path from executive totals to transaction detail |
| Ownership | Named owner for definitions, refreshes, QA, stakeholder sign-off, access, and model changes |
| Change control | Change log, versioned metric dictionary, incident process, and restatement process |
A trusted attribution dashboard is an operating process, not a one-time build. It needs a strong data base, clear metric definitions, visible model assumptions, and governance tied to pipeline, revenue, and business decisions. Start small with a stable metric set: spend, conversions, qualified opportunities, closed-won revenue, attributed revenue, cost per opportunity, and return on ad spend. Expand only after the core reporting makes it through at least one full reporting cycle and reconciliation with CRM and finance. That’s what keeps channel, campaign, and revenue reporting steady over time.
FAQs
How do I choose the right attribution model?
Pick the attribution model that matches your decision cadence, buying journey, and data depth. Use MMM for quarterly budget planning, MTA for daily optimization, and account-level measurement when you’re dealing with long B2B sales cycles.
If the path to purchase is short and simple, single-touch models can do the job. If buyers take more steps before converting, multi-touch or algorithmic models are usually a better fit. It also helps to check model output against holdout tests or geo-lift studies, and to favor setups that can plug into your data stack without a lot of friction.
What should I fix first if attribution data is unreliable?
Start with your data foundation. Before you do more analysis, line up metric definitions across platforms and standardize campaign naming rules and UTM parameters. That cuts down on inconsistency and fragmented reporting.
Then audit conversion events, tracking codes, and server-side API integrations to make sure they’re set up correctly and deduplicated. Back that up with regular accuracy checks and clear data ownership.
Which revenue metric should my dashboard use?
Use the metric that best connects marketing activity to revenue based on your audience and your goal.
For executive reporting, focus on total revenue, blended ROAS, and CAC. Those numbers give leadership a clear view of business impact without getting lost in channel-level noise.
For campaign reporting, track revenue by touchpoint, conversion rates by source, and pipeline velocity. Then match platform reporting against your CRM or order data to check accuracy. Platform dashboards are useful, but they don’t always line up cleanly with closed revenue.