Want to make your marketing eco-friendly and data-driven? Business Intelligence (BI) tools like Tableau, Power BI, and QlikView are helping businesses track sustainability metrics, optimize resources, and align with consumer demand for transparency. Here's the big picture:
- Tableau: Best for visualizing complex data, real-time analytics, and ESG reporting. Great for storytelling but comes with a higher price tag.
- Power BI: Affordable, integrates with Microsoft tools, and offers AI-powered insights. Ideal for small-to-medium businesses but less advanced visuals.
- QlikView: Excels at uncovering data connections and handling large datasets. Offers deep insights but has a steeper learning curve and higher costs.
- Marketing Analytics Tools Directory: Free resource for comparing BI tools with features tailored to green marketing.
Key Stats:
- 95% of U.S. consumers value eco-labels in purchasing decisions.
- 63% of companies plan to expand sustainability-focused marketing by 2025.
Whether you're aiming to reduce waste, track carbon emissions, or avoid greenwashing, these tools empower smarter, data-backed decisions. Ready to choose the right platform? Let’s dive in.
Future Trends in Green Marketing
1. Tableau
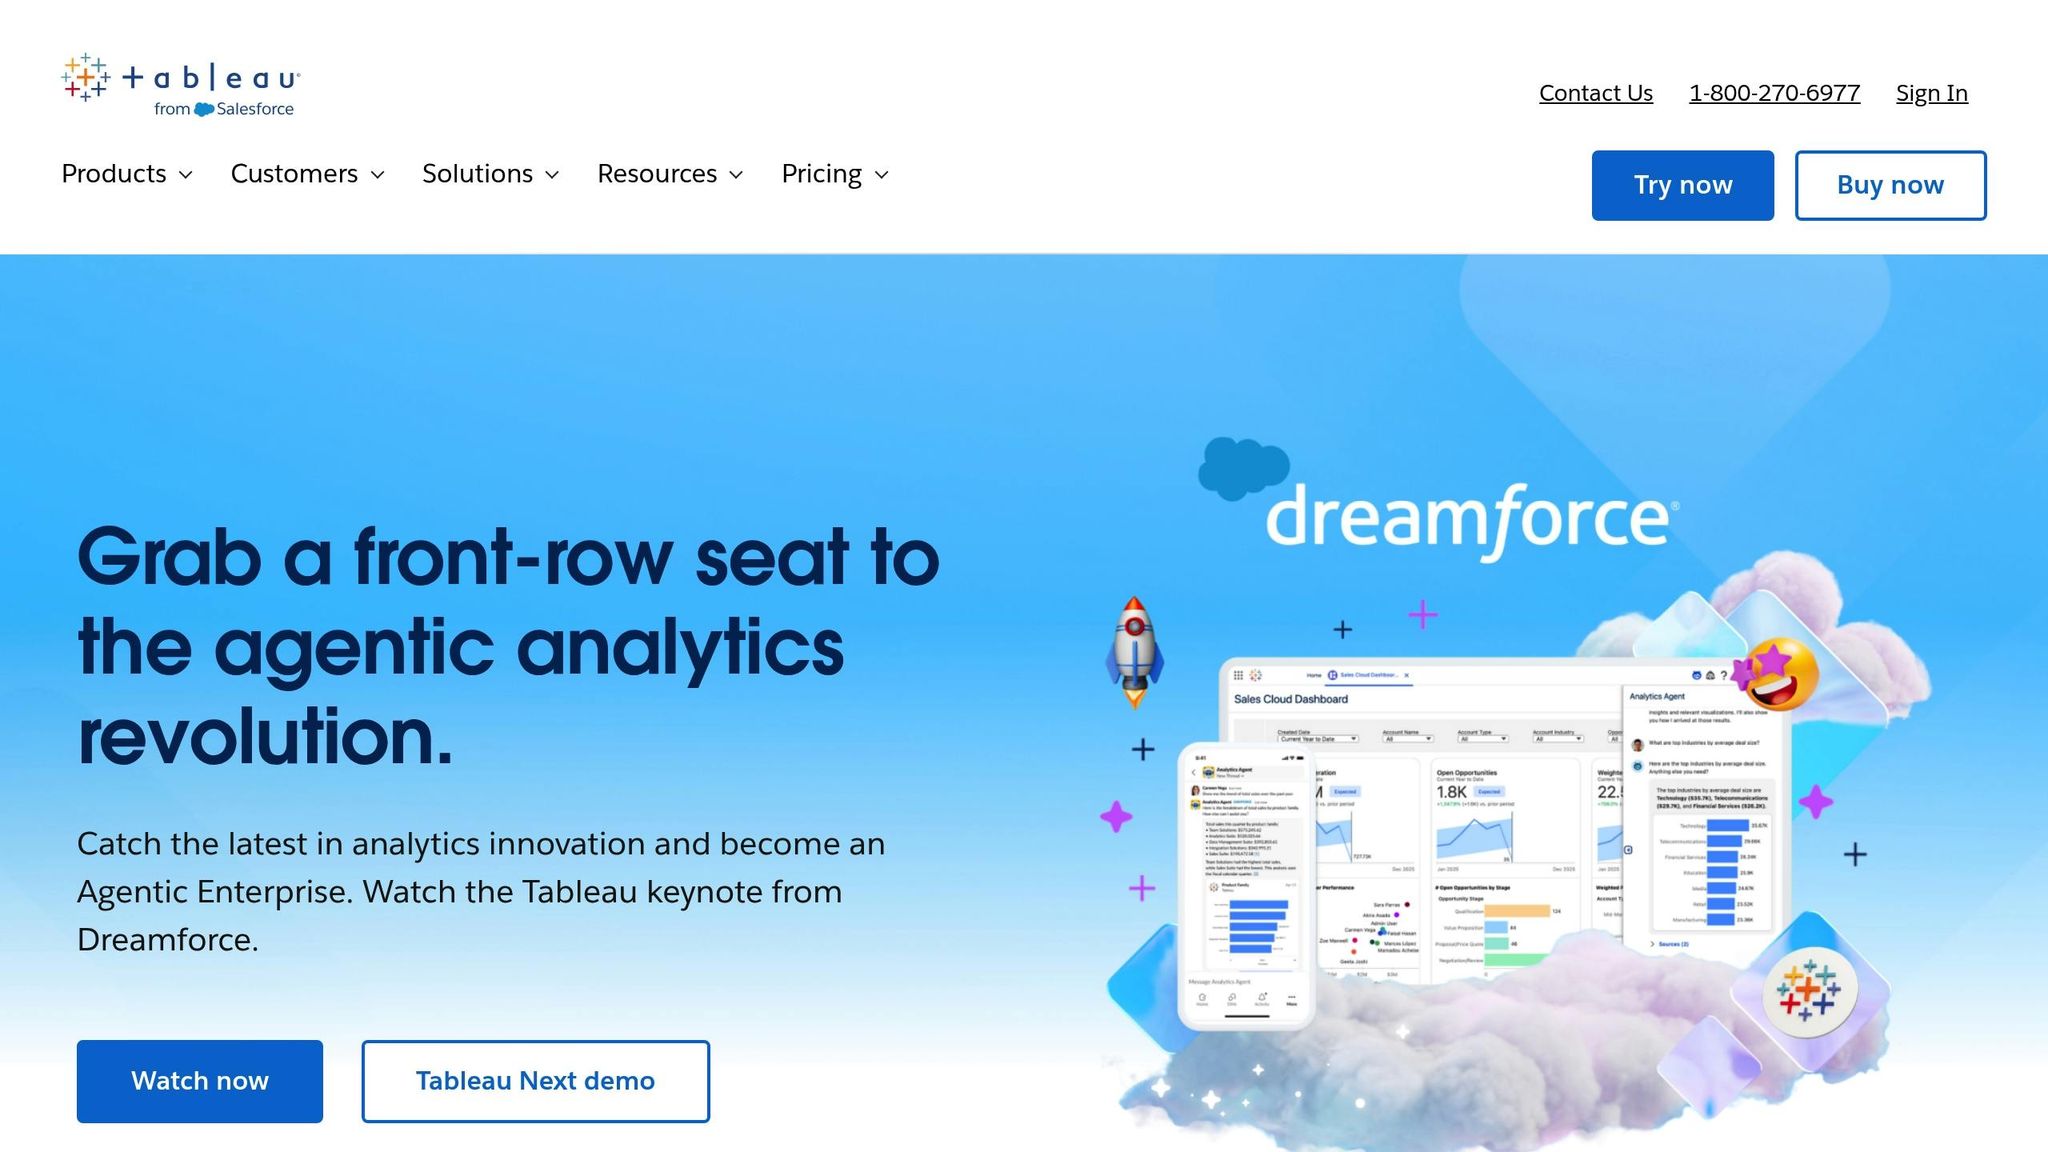
Tableau turns complex sustainability data into straightforward, actionable insights, making it a powerful tool for green marketing. With its advanced data visualization tools, Tableau is particularly useful for tracking metrics like carbon emissions, energy use, and waste reduction across various marketing efforts.
The platform brings together data from multiple sources - IoT sensors, cloud databases, customer feedback tools, and sales systems - into one unified dashboard. This integration is a game-changer for green marketing, as it helps organizations link environmental impact directly to campaign performance.
One of Tableau’s standout features is its real-time analytics, which allow marketers to monitor green campaigns as they happen. Teams can track customer engagement, sales of eco-friendly products, and environmental outcomes in real time. This instant feedback makes it easier to tweak strategies on the fly, ensuring both marketing ROI and sustainability targets are met.
Tableau’s interactive dashboards are another key advantage. These dashboards simplify the presentation of sustainability data, making it more accessible to stakeholders. With its visual storytelling tools, companies can turn complex environmental metrics into clear, engaging formats. This is particularly valuable for building trust with eco-conscious consumers while avoiding accusations of greenwashing. Instead of relying on static sustainability reports, marketers can create dynamic, automatically updating visualizations that are not only engaging but also help with regulatory compliance.
The platform also supports ESG reporting standards, making it easier for businesses to meet regulations while showcasing their green marketing achievements. Many large companies use Tableau to align with frameworks like the Global Reporting Initiative (GRI) and the Sustainability Accounting Standards Board (SASB). This ensures that marketing claims are backed by credible, verifiable data.
Tableau goes a step further with AI and machine learning capabilities, offering predictive analytics to forecast how green campaigns might impact sales and engagement. These tools help teams allocate resources more effectively and fine-tune sustainability messaging for their target audiences.
The platform provides flexible pricing plans to suit businesses of all sizes. For those looking to share their sustainability efforts more broadly, Tableau Public - a free version - lets marketers publish dashboards publicly, boosting transparency and brand trust.
For U.S. businesses using Tableau in green marketing analytics, setting clear sustainability goals and relying on accurate data sources are critical. Collaboration between marketing, sustainability, and IT teams is essential to design dashboards that meet both business objectives and domestic regulations. Next, we’ll explore how Power BI approaches sustainable analytics.
2. Power BI
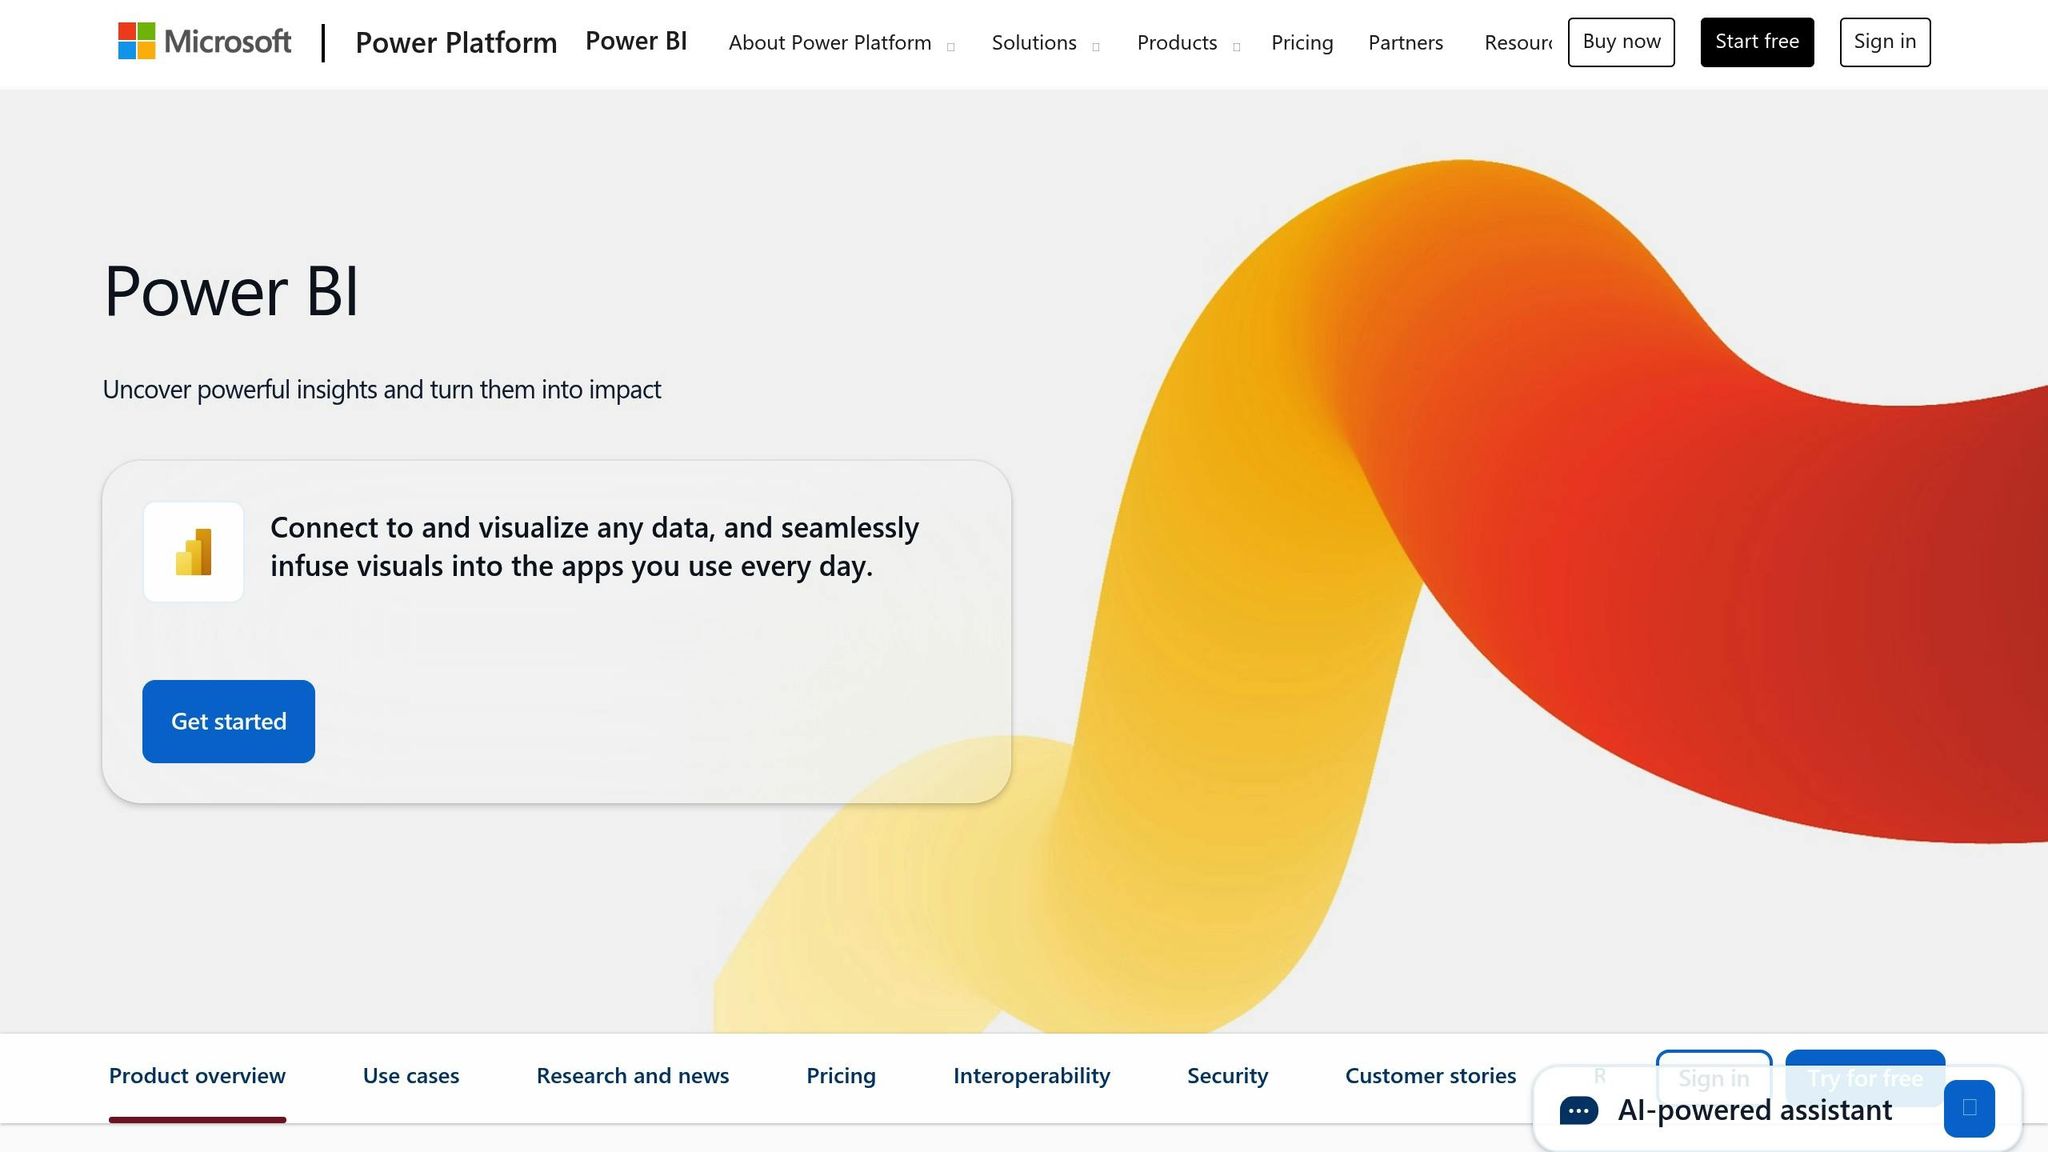
Microsoft's Power BI is a straightforward and affordable tool for businesses aiming to incorporate green marketing analytics into their daily operations. With pricing starting at just $10 per user per month for Power BI Pro, it’s an accessible option for companies of all sizes looking to monitor their sustainability efforts.
A major advantage of Power BI is its seamless integration with Microsoft 365. This connection allows marketing teams to pull sustainability data from familiar tools like Excel and SharePoint. It also enables businesses to centralize data from diverse sources - such as IoT sensors tracking energy use, supply chain databases monitoring carbon emissions, and third-party platforms measuring eco-label performance - into a single, unified dashboard [6, 10]. This consolidation supports real-time insights, helping teams make informed decisions.
Power BI’s ability to track eco-label performance in real time is particularly impactful for green marketing strategies. For instance, a U.S.-based retail chain used Power BI to monitor the percentage of products carrying eco-labels like "USDA Organic" or "Carbon Neutral." By analyzing the dashboard, they identified which eco-friendly products drove the most revenue, allowing them to fine-tune their marketing strategies and procurement plans.
The platform also leverages AI-powered analytics to uncover sustainability trends and predict demand for eco-friendly products. These machine learning tools can even estimate the return on investment (ROI) for green initiatives before significant resources are committed [2, 4, 6].
Another standout feature is Power BI’s automated reporting capabilities, which simplify ESG compliance. The platform generates sustainability reports that align with various standards and automatically updates stakeholders on progress toward environmental goals. This not only builds trust with eco-conscious consumers but also reduces the manual workload typically associated with compliance reporting [5, 7].
Studies show that real-time eco-label tracking can significantly influence purchasing behavior, making accurate measurement a critical factor for staying competitive.
For U.S. businesses, Power BI offers flexibility in tailoring dashboards to local preferences, such as displaying currency in dollars ($), using MM/DD/YYYY date formats, and applying imperial units for consumer-facing data (with metric units reserved for scientific reporting).
To help businesses determine the best analytics solution for their green marketing needs, the Marketing Analytics Tools Directory provides a detailed comparison of Power BI and other platforms, ensuring companies find the right fit for their goals and infrastructure.
3. QlikView
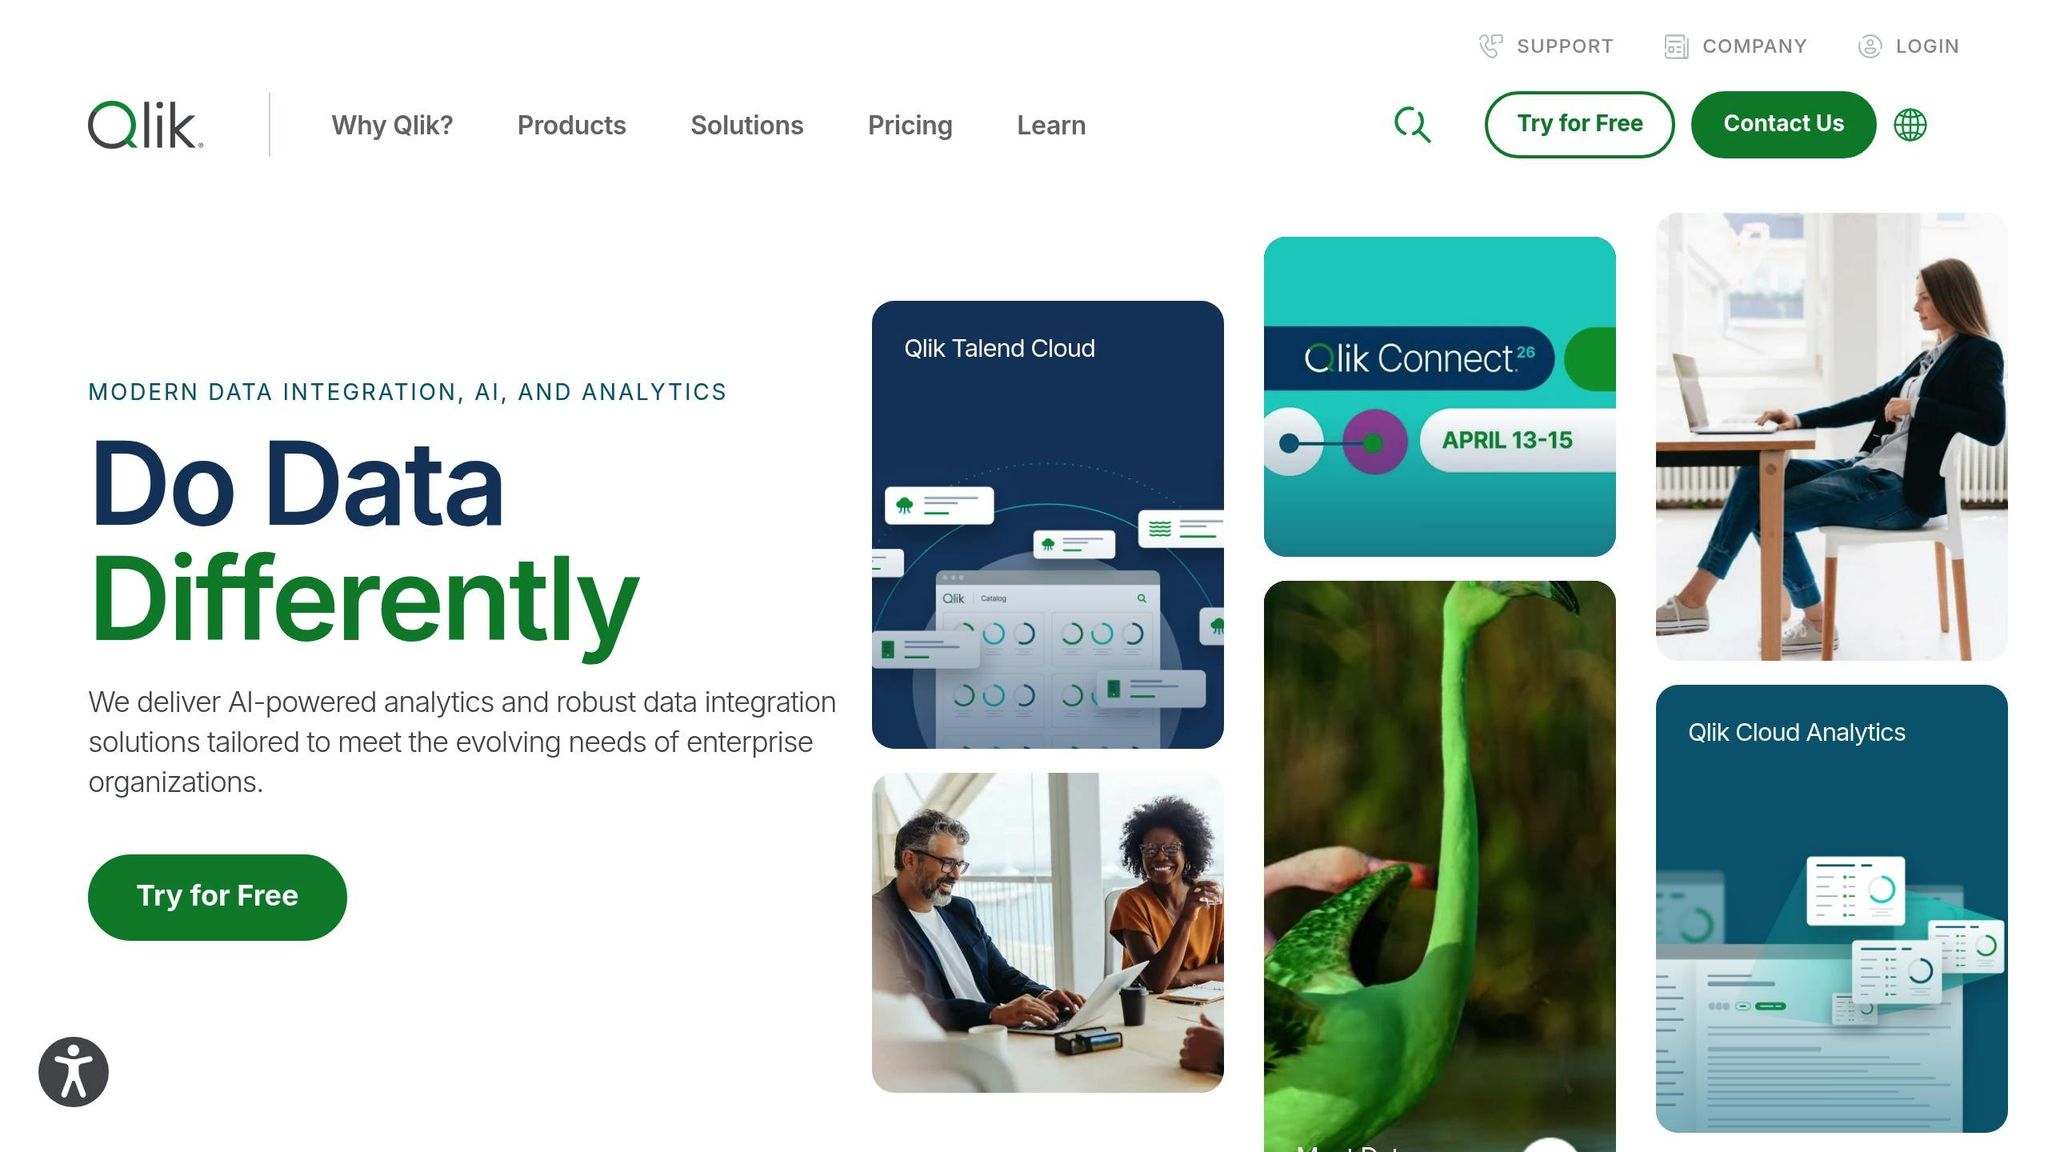
QlikView stands out in sustainability reporting thanks to its associative data model. This feature allows users to explore connections within data without limitations, making it especially helpful for uncovering hidden sustainability trends. This capability is a game-changer for green marketing teams aiming to see how various sustainability efforts tie into overall business performance. On top of that, QlikView’s real-time integration adds even more value for sustainable marketing initiatives.
The platform’s strength lies in its ability to integrate real-time data from various sources, such as supply chain, production, and marketing systems. This data is then presented in detailed dashboards that track critical metrics like carbon emissions, energy use, water consumption, and waste reduction. These comprehensive dashboards give businesses a clear view of their environmental impact.
Another key advantage is QlikView’s customizable dashboards, which simplify ESG (Environmental, Social, and Governance) compliance. Companies can automate their reporting processes by tailoring dashboards to monitor adherence to US-specific standards, such as EPA guidelines, SEC climate disclosure rules, and eco-label certifications. The platform also aligns with US formatting requirements, including dollars ($), MM/DD/YYYY dates, and mixed imperial/metric units.
QlikView’s ability to provide real-time access to verified sustainability metrics helps businesses avoid greenwashing - a major concern in today’s eco-conscious market. By offering transparency, the platform builds consumer trust, which is critical as 95% of customers reportedly base their purchasing decisions on eco-labels and certifications.
That said, there are some factors to consider when implementing QlikView. Pricing is typically customized based on factors like company size and deployment needs, with enterprise licenses often starting in the low five-figure range annually. Additionally, non-technical users may face a steeper learning curve compared to simpler business intelligence tools. However, investing in proper setup and training ensures businesses can fully leverage QlikView’s green marketing potential.
For companies weighing their options, the Marketing Analytics Tools Directory offers detailed comparisons of QlikView and other analytics platforms. This resource can help organizations choose the best tool for their sustainability reporting and green marketing objectives.
sbb-itb-5174ba0
4. Marketing Analytics Tools Directory
This directory brings together essential tools tailored for green marketing strategies. Acting as a central hub, it highlights Business Intelligence (BI) solutions specifically aligned with eco-friendly marketing goals, offering businesses a streamlined way to explore and compare analytics tools.
A standout feature of the directory is its emphasis on tools that promote transparent data collection and integrate with third-party certifications. Businesses can find solutions that work with eco-label certifications and provide measurable sustainability metrics. This not only helps fight greenwashing but also strengthens consumer trust by showcasing verifiable environmental efforts.
The directory is particularly useful for sustainability-driven marketers. It allows users to filter tools based on specific needs, such as real-time analytics, reporting dashboards, or big data platforms. Key features include options for tracking carbon footprints, generating sustainability reports, and segmenting audiences by eco-conscious behaviors. This saves businesses valuable time when assessing tools for their green marketing initiatives.
For companies operating in the U.S., the directory highlights tools that ensure compliance with local standards. These tools incorporate U.S. dollars, appropriate measurement units, and American data sources, making them highly relevant for domestic businesses.
To simplify decision-making, the directory provides side-by-side comparisons of pricing, features, and user ratings. This enables organizations to evaluate cost-effectiveness and estimate their return on investment when choosing BI tools for sustainability-focused programs.
For businesses new to data-driven environmental reporting, the platform also offers practical advice from industry experts. Recommendations include starting with scalable tools and expanding analytics capabilities as sustainability objectives evolve, ensuring a manageable and effective approach to green marketing analytics.
Additionally, the directory features case studies that illustrate real-world successes. For instance, U.S.-based retailers have used BI dashboards to monitor and reduce packaging waste, sharing these achievements with environmentally conscious consumers. These examples, combined with expert guidance, help businesses confidently select the right BI tools for their sustainability goals.
This resource meets the growing demand for eco-conscious brands. With 77% of U.S. consumers motivated to support companies committed to the environment, the directory plays a vital role in helping businesses make informed BI investments for green marketing.
Pros and Cons
Every BI tool has its own set of strengths and limitations when it comes to green marketing. Understanding these differences is key to aligning your sustainability goals with the right solution. Below is a breakdown of the main features and trade-offs for some popular tools.
Tableau stands out for its advanced visualization capabilities, making it easier to interpret complex sustainability metrics. It also offers real-time tracking and strong data integration, which can significantly enhance eco-focused campaigns. However, its higher price tag and the need for training to fully utilize its features might be challenging for organizations with limited budgets.
Power BI is a more affordable option that integrates seamlessly with Microsoft products. Its AI-powered analytics can help uncover eco-friendly behavior patterns, making it a solid choice for those already using the Microsoft ecosystem. That said, its visualizations don’t quite match Tableau’s, and integrating data from non-Microsoft sources can be a bit of a hassle.
QlikView shines when it comes to handling large datasets and uncovering deep sustainability insights through its associative data modeling. This makes it a strong contender for businesses needing detailed analysis. However, its steep learning curve, higher costs, and less intuitive interface may require additional IT support.
The Marketing Analytics Tools Directory provides a free resource for comparing tools and includes filters tailored to sustainability features that comply with U.S. standards. This can be a valuable guide for aligning your tool choice with green marketing strategies.
| Tool | Key Strengths | Main Weaknesses | Monthly Cost (USD) |
|---|---|---|---|
| Tableau | Advanced visualization; real-time sustainability tracking; strong data integration | Higher cost; steep learning curve; may require custom development for green metrics | $70/user |
| Power BI | Cost-effective; seamless Microsoft ecosystem integration; AI-driven eco-behavior analysis | Limited advanced analytics; may slow with large datasets; challenges with non-Microsoft integrations | $10–$20/user |
| QlikView | Powerful data discovery; associative analytics; efficient large dataset processing | Complex setup; less intuitive interface; higher enterprise costs | $30/user |
| Marketing Analytics Tools Directory | Comprehensive tool comparison; sustainability-focused filtering; U.S. compliance features | – | Free access |
Choosing the right tool comes down to your specific needs. If your focus is on visually showcasing sustainability efforts, Tableau might be worth the investment. For businesses already embedded in the Microsoft ecosystem, Power BI offers cost-effective collaboration despite some limitations. Meanwhile, organizations requiring in-depth data exploration may find QlikView’s complexity and cost justified for its robust insights into green marketing strategies.
Conclusion
When comparing Tableau, Power BI, QlikView, and the Marketing Analytics Tools Directory, it’s clear that BI tools are playing a transformative role in green marketing. Each platform brings unique strengths to the table, helping U.S. businesses stay compliant with regulations while addressing the growing consumer demand for transparency and measurable environmental efforts.
What stands out is how these tools empower businesses to make smarter, data-driven decisions. By leveraging predictive analytics, companies can anticipate sustainability trends and allocate resources more effectively, moving from reactive strategies to proactive, informed actions.
AI-powered BI platforms take things further, improving campaign accuracy and resource management. These advancements pave the way for actionable steps businesses can take to integrate sustainability into their marketing efforts.
For companies ready to embrace BI tools for eco-conscious strategies, there are a few key steps to consider. Start by adopting cloud-based solutions and ensuring teams are trained in AI-driven analytics. The Marketing Analytics Tools Directory is a helpful resource for evaluating platforms with strong sustainability features tailored to U.S. market needs.
Transparency and authenticity remain essential. BI tools make it possible to monitor and report sustainability efforts in real time, enabling businesses to share data that not only builds trust but also demonstrates a genuine commitment to environmental responsibility. This aligns with the rising consumer expectation for tangible action rather than vague promises.
FAQs
How can business intelligence tools like Tableau, Power BI, and QlikView help reduce greenwashing in marketing campaigns?
Business intelligence (BI) tools like Tableau, Power BI, and QlikView play a key role in ensuring transparency and accountability in green marketing. By offering real-time data analysis, these tools allow marketers to back up sustainability claims with solid evidence, minimizing the chances of misleading or exaggerated statements.
Features such as custom dashboards, data visualization, and advanced reporting make it possible for companies to assess the environmental impact of their operations and marketing efforts. This means campaigns can rely on precise, data-driven insights instead of vague or unsupported claims, helping to build trust and confidence among consumers. Using BI tools thoughtfully enables businesses to align their marketing strategies with meaningful sustainability objectives.
What should small and medium-sized businesses consider when selecting a business intelligence tool for green marketing analytics?
When selecting a business intelligence (BI) tool like Tableau, Power BI, or QlikView for analyzing green marketing efforts, small and medium-sized businesses should keep a few important factors in mind.
First, ease of use is essential. Choose a tool that matches your team's technical skills and provides a user-friendly interface to make data visualization and insights straightforward. Next, think about your budget - compare pricing plans to ensure the tool fits your financial limits while still offering the key features you need.
It's also important to look at the tool's integration capabilities. Make sure it can connect smoothly with your existing systems and marketing platforms to enable real-time analytics. Finally, check if the tool offers customizable dashboards and supports features like tracking your carbon footprint or analyzing the performance of sustainable products. Picking the right tool can streamline your green marketing strategies and help achieve impactful results.
How can businesses use BI tools to incorporate real-time sustainability metrics into their green marketing strategies?
Businesses today can use business intelligence (BI) tools to seamlessly incorporate real-time sustainability metrics into their marketing strategies. These tools help track essential environmental indicators like carbon footprint, energy consumption, and waste reduction, ensuring marketing efforts are aligned with sustainability goals.
With BI tools, companies can craft campaigns that are both transparent and engaging for eco-conscious audiences. For instance, they can use real-time data to demonstrate measurable progress toward sustainability targets, allocate resources more efficiently, and showcase environmentally responsible practices in their messaging. This approach not only strengthens brand trust but also fosters deeper connections with customers who value green initiatives.