If you run multiple locations, geography should drive 3 decisions: where I open next, where I put budget, and where I stop stores from stealing demand from each other.
I’d keep the process simple. First, I define the right unit - market, trade area, or territory. Then I measure local demand, overlap risk, and location-level performance. Last, I tie those findings to revenue, margin, and budget moves. That is how I avoid bad site picks, weak market reports, and wasted ad spend.
Here’s the short version:
- Markets help me shift regional budget and compare cities
- Trade areas help me judge site demand and overlap
- Territories help me set boundaries and reduce internal conflict
- Drive-time analysis is better than plain radius checks for dense areas
- Cannibalization checks should happen before lease terms are set
- Closed-loop attribution helps connect geography to revenue and EBITDA
- Monthly and quarterly reviews keep market data, boundaries, and spend in line
A few numbers matter right away:
- 20% to 40% marketing efficiency gains are often tied to revenue-linked attribution
- Data older than 60 days can lead to weak site calls in fast-moving markets
- I need to judge 2 demand layers - market-level demand and site-level demand
If I had to reduce the article to one point, it would be this: good geographic analysis is not just mapping - it is a repeatable way to size demand, test overlap, and move capital with less guesswork.
Territory Design and Market Sizing
Defining Territories with ZIP Codes, Counties, MSAs, and Drive-Time Areas
Pick the boundary format based on the decision you need to make. That’s the main call here.
| Method | Accuracy | Data Needs | Setup Effort | Best-Fit Use Case |
|---|---|---|---|---|
| ZIP Code | Moderate | Low | Low | Service-area businesses, direct mail, and franchise territory protection |
| County/MSA | Low | Low | Low | Corporate management rollups and national-to-regional budget allocation |
| Radius Ring | Moderate | Low | Very Low | Quick-service restaurants and simple digital ad geo-fencing |
| Drive-Time | High | High | Moderate | Retail site selection and urban cannibalization checks |
ZIP codes are often the best choice for day-to-day use because they tie cleanly to CRM records, billing systems, and direct mail lists. The catch is simple: ZIP boundaries are built for mail delivery, not how people move through a market.
County and MSA views work well for management rollups and regional comparisons. They’re fine for budget allocation at a high level, but they’re too blunt for site-level calls.
Drive-time areas usually give the best picture for site selection. They reflect traffic, road networks, and physical barriers, which matters a lot in dense urban markets. Radius rings can still help when you need a fast, simple view, like geo-fencing around a quick-service restaurant.
Once you choose the boundary, the next job is to measure 2 things inside it: demand and overlap.
Sizing Market Potential with Demographic and Performance Data
Use both outside market data and your own operating data.
On the demand side, the U.S. Census Bureau's American Community Survey (ACS) gives you population counts down to the census-tract level through table B01003, plus median household income through S1901 or DP03. Add daytime workers and commuters with Census LODES workplace files. Then layer in competitor density so you can tell the difference between open demand and markets that are already crowded [9].
On the performance side, look at internal metrics by location, including lead volume, cost per lead, conversion rates, and revenue. Compare each territory against network-wide benchmarks [3]. If a territory has strong demographics but weak conversion, that usually points to an execution problem, not a market problem. Statistical modeling matters here because small samples can make weak signals look bigger than they are, and some gaps disappear once you test them [8].
"GIS answers 'where,' but statistics answers 'so what.'" - Showroom Solutions [8]
That analysis gives you the base for site priority, budget moves, and territory review.
Tools for Territory Planning and Market Comparison
Use the lightest tool stack that fits the boundary type and data grain you need. Teams can start with free mapping tools and Census data, then move up to mid-market GIS platforms or enterprise BI and reporting tools as the work gets more detailed [9].
If your team wants to fold territory planning into BI and reporting, the Marketing Analytics Tools Directory can help compare tool categories.
sbb-itb-5174ba0
How Modern Retailers do Geospatial Analysis
Cannibalization Checks and Local Demand Patterns
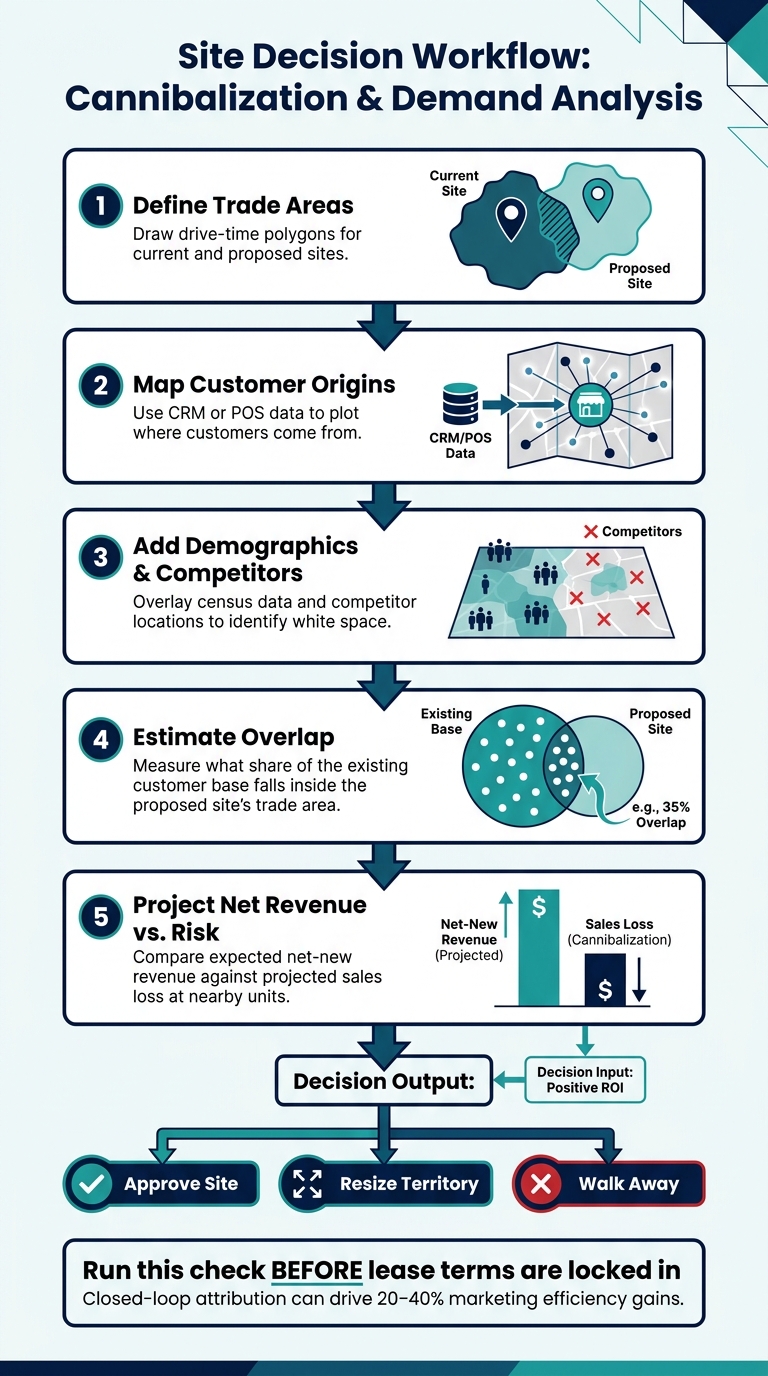
Geographic Analysis Workflow for Multi-Location Brands
Measuring Cannibalization Across Existing and Proposed Locations
After you size the market, test for overlap. The core question is simple: will the new site grow demand, or just move it around?
A new location can do 2 things. It can pull in net-new demand from people the brand was not reaching before, or it can create transferred demand by moving current customers from one store to another. That mix tells you whether the system grows or whether sales just get redistributed. [8]
The main metrics to watch are overlap percentage, visit transfer rate, and cannibalization-adjusted same-store sales. A site may look good on gross revenue and still hurt total market profit. That’s why gross revenue on its own can point you in the wrong direction. [8]
Compare the 3 approaches below. [9]
| Approach | Required Data | Complexity | Decision Quality |
|---|---|---|---|
| Simple Distance Check | Basic address/GPS | Low | Low - ignores traffic, barriers, and actual demand |
| Trade-Area Overlap Analysis | Customer addresses, GIS drive-time polygons | Medium | Medium-High - overlap between customer catchments |
| Gravity-Model Approach | Historical sales, foot traffic, competitor pull, statistical modeling | High | High - predicts visit probability based on distance and site attractiveness |
A simple distance check is fine for a first pass. If you're making multi-unit decisions, a gravity model is usually worth the extra work. [9]
Reading Local Demand at the Market and Site Level
Read demand at 2 levels: market level and site level. Mix those up, and bad calls follow.
Macro signals tell you if a market is worth entering. Micro signals tell you which address inside that market has the best shot. At the macro level, look at population growth, median household income, consumer spending in your category, and daytime employment density. Residential population by itself misses the lunch crowd, commuters, and office workers. Census LODES workplace files can help estimate where office workers cluster and give you a better read on daytime demand.
At the micro level, the job changes. Here, you’re looking at site-specific factors like competitor density, parking, traffic flow, center traffic, and tenant mix. Those details often decide whether one corner works and another one stalls. If a nearby store is already overcapacity - packed parking lots, long waits, or booked appointments - a second site may pull in net-new demand rather than just siphon sales. [2]
A Step-by-Step Workflow for Site Decisions
Run the same overlap test before lease terms are locked in. For U.S. operators comparing several locations, a steady process helps avoid over-expansion and missed openings.
- Define trade areas for current and proposed sites with drive-time polygons.
- Map customer origins using CRM or POS data.
- Add demographics and competitors to spot white space.
- Estimate overlap by measuring what share of the current customer base sits inside the proposed site’s trade area.
- Project net revenue versus risk by comparing expected net-new revenue with the expected sales loss at nearby units.
Use that result to approve the site, resize it, or walk away. [8]
That overlap result then feeds budget and territory planning.
Regional Budget Shifts and Market-Level Reporting
How to Shift Budget by Market Potential and Performance
Shift spend based on market stage, not just store-level results. New markets usually need more awareness. Mature markets should lean more into conversion and retention.
Geo-tagged Cost Per Acquisition (CPA) heatmaps help teams spot low-cost acquisition clusters and high-intent pockets - the neighborhoods or ZIP codes where added spend is most likely to pay off.[3] But CPA alone is not enough. Pair it with unit economics, especially contribution margin by location rather than gross revenue alone. A market can look strong on top-line revenue and still hurt EBITDA if local CAC is too high or if nearby units are bidding against each other in paid search.
Clear market boundaries matter here. So do exclusion lists in paid campaigns. Without them, adjacent locations can end up competing for the same demand and muddying attribution.[7][6]
"Leads are an input, not an outcome. The question a multi-location brand actually needs answered is what the marketing did to revenue, in dollars, across the network and in each market." - Matt Lillestol, PowerChord [1]
What to Report by Store, Territory, Market, and Region
Store metrics should guide local operations. Market and region metrics should guide media and capital allocation. Each reporting layer needs its own job. If every level tracks the same numbers, teams get noise instead of direction.
| Reporting Level | Primary KPI Focus | Decision Type | Management Audience |
|---|---|---|---|
| Store | Google Business Profile actions (calls/directions), review velocity, local conversion rate | Local staffing, hours, and neighborhood-level promotions | Store/Branch Manager |
| Trade Area | Catchment overlap, competitor density, distance to nearest rival | Site selection, pop-up placement, and cannibalization checks | Regional Marketing Manager / Real Estate Analyst |
| Territory | Territory coverage, sales efficiency, lead volume relative to market size | Boundary revisions, sales route alignment, and territory protection | Territory Manager / Ops Lead |
| Market (City) | ROAS by city, geo-tagged CPA, market share proxies | Media spend rebalancing and regional budget shifts | Marketing Director / CFO |
| Region | Total revenue, EBITDA impact, pipeline velocity, regional CAC | Market entry/exit, capital allocation, and portfolio rationalization | CRO / PE Operator / Executive |
Connecting Geographic Metrics to Revenue and EBITDA
Geographic reporting only matters if it changes revenue and margin decisions. Coverage gaps, demand white space, and overlap risk can all affect revenue and EBITDA, but only when the reporting setup ties those signals back to financial outcomes.
That means tracking lead sources from first touch, carrying that data through the CRM, and matching it to POS data at checkout.[1][4] This is the core of closed-loop attribution. Companies that build this across a location network typically see 20–40% improvements in marketing efficiency by moving budget toward stronger channels and markets.[4]
A simple starting point is standardizing UTM naming by location code. For example, utm_location=chi_loop for a Chicago Loop store. That small step helps prevent data silos and makes roll-up reporting at the corporate level much easier.[4]
For teams reviewing tools for geographic-to-financial reporting, the Marketing Analytics Tools Directory includes options for attribution and revenue-linked reporting.
That makes the next step less about more data and more about a repeatable review process with clear ownership.
Making Geographic Analysis a Repeatable Process
After budget and market reporting, the next move is to put geographic analysis on a set review cycle. Don’t treat it as a one-off exercise that only shows up when someone wants to open a new site. Tie it to territories, trade areas, and market-level reporting, and run it on schedule.
A Monthly and Quarterly Review Process
Set a monthly review to track store traffic, lead volume, and cost per lead by market. Run a regular NAP audit as part of that cycle so location data stays aligned across platforms. Then use a quarterly review to look at location-level attribution data and update models for seasonal and regional ROI changes.
"A monthly report tells you what already happened... A live view tells you what is happening now, while you can still act on it." - Matt Lillestol, PowerChord [1]
Run that same review before every proposed site. That keeps overlap risk in plain view instead of turning it into a last-minute surprise. Before approval, map competitors, measure density, check daytime population, and clear cannibalization risk. The focus should stay on trade-area overlap, daytime demand, and nearby-site impact.
Keep reporting under one hierarchy:
- corporate rollups
- regional territory views
- store-level benchmarks
Also, use one location code per store across all systems. If every team uses a different store ID, reporting turns into cleanup work.
Common Data and Governance Mistakes to Avoid
Most failures here come from messy data, not bad analysis. The biggest problem is using different geographic definitions across teams. One team reports by ZIP code, another by MSA, and suddenly people think they’re discussing the same market when they’re not. That leads to misallocated budget, distorted territory reviews, and false site approvals. Pick one boundary standard and use it in every report.
The second major risk is stale data. Local market conditions can change fast. If you use demographic or competitor data that is more than 60 days old for site decisions, you may be acting on a market picture that has already changed. [5] Add inconsistent UTM naming across locations, and corporate roll-up reporting becomes a manual reconciliation project instead of a live signal.
"The aggregate hides the local story, and the local view hides the pattern." - PowerChord [1]
Version control also matters. When territory boundaries change, document what changed, why it changed, and what the prior version was. If you skip that step, protected territory enforcement turns into an argument instead of a data review.
To keep reporting current and tied to revenue, use tools across a few core areas:
- location analytics
- competitor mapping
- BI dashboards
- attribution tools
For teams comparing platforms in those categories, the Marketing Analytics Tools Directory lists and compares options for attribution, BI dashboards, and revenue-linked reporting.
Conclusion: The Core Decisions Geographic Analysis Should Drive
Geographic analysis should drive 3 decisions: where to expand based on actual demand, how to allocate spend by market performance, and how to control overlap so current locations are protected. Brands that run this process on a repeat basis spot issues earlier and put capital to work with more certainty.
FAQs
How do I choose between ZIP codes, MSAs, and drive-time trade areas?
Choose the territory model based on market density and how you want to assign coverage. Use drive-time or radius models when convenience and travel patterns matter most. Use ZIP codes when you need fixed service areas or want to cut overlap between nearby locations.
For market potential, cannibalization checks, and tighter planning, drive-time and polygon-based trade areas are usually more accurate than static ZIP codes. The point is simple: set clear boundaries so each location stays in its own lane.
How can I tell if a new location will add demand or cannibalize existing stores?
Look past aggregate data. Map competitor proximity against local demand signals - population growth, household income, foot traffic, and consumer spending - to see if a site fills an underserved gap or simply draws sales away from your current stores.
Just as important, keep each location’s marketing tied to distinct, non-overlapping territories. Then compare each site’s ROI against similar peer locations so you can spot cannibalization fast.
What geographic metrics should I tie to revenue and EBITDA?
Tie geographic metrics to revenue and EBITDA by going past national averages. The goal is simple: connect local digital signals to offline sales, then put money where it earns the best return.
Track metrics like city-level ROAS, market-level customer acquisition cost against revenue influenced by marketing, and local high-intent actions such as calls and directions. Look at location-specific attribution patterns and run geo-level incrementality tests to see which markets are driving lift, not just activity.
Use those inputs to steer budget toward markets with the strongest growth potential and better capital deployment.