Want better business performance tracking? These 5 tools simplify KPI benchmarking by turning raw data into actionable insights. Whether you're a startup or a large enterprise, these platforms help monitor progress, spot trends, and compare metrics effectively.
Key Takeaways:
- monday work management: Combines project tracking with KPI dashboards, ideal for small to medium businesses.
- Tableau: Advanced data visualization for large datasets; great for medium to large enterprises.
- Power BI: Real-time monitoring and Microsoft integration; suited for medium to large enterprises.
- Klipfolio: Pre-built templates for quick setup; best for small to medium businesses.
- Databox: Mobile-first design with push notifications; perfect for small teams needing simplicity.
Quick Comparison
| Tool | Best For | Main Features | Pricing Tier |
|---|---|---|---|
| monday work management | Small to medium businesses | Project-linked KPIs, visual dashboards | Affordable |
| Tableau | Medium to large enterprises | Interactive dashboards, trend analysis | Premium |
| Power BI | Medium to large enterprises | Real-time alerts, AI-driven insights | Budget-friendly |
| Klipfolio | Small to medium businesses | Customizable dashboards, fast setup | Mid-range |
| Databox | Small teams | Mobile-friendly, goal tracking | Flat-rate pricing |
Find the right tool for your business size and goals. These platforms make KPI tracking simpler and more effective for 2025's fast-paced market.
KPIs V. Benchmarking and How to Use them Together
How We Selected These KPI Benchmarking Tools
We chose these tools based on their ability to address the specific needs of small teams, mid-sized businesses, and large enterprises. Each tool offers features and pricing suited to different business sizes, ensuring a well-rounded evaluation across various operational scales.
For small teams and startups, simplicity, affordability, and ready-to-use templates for easy KPI tracking were key priorities.
Mid-sized businesses and agencies benefit from tools that strike a balance between advanced features, scalability, and extensive integration options to handle complex reporting needs across multiple clients or departments.
When it comes to enterprises, the focus shifts to platforms capable of managing large datasets, performing detailed analytics, supporting multiple user roles, and offering deep integration capabilities.
Top 5 Tools for KPI Benchmarking in 2025
Here’s a look at five standout tools that turn raw data into meaningful KPIs.
monday work management
monday work management combines project management with KPI tracking through customizable dashboards and automated updates. It links project milestones and daily tasks directly to KPIs, creating a clear connection between day-to-day activities and overarching goals. The platform’s visual features - like drag-and-drop widgets and color-coded status indicators - make it easier to track progress while cutting down on manual data entry. This makes it an appealing choice for startups and growing businesses seeking a simple yet effective way to monitor KPIs.
Tableau
Tableau is widely known for its powerful data visualization and analytics. It can handle large datasets and transform them into interactive dashboards that provide instant insights. Its analytical engine helps users spot trends, detect anomalies, and identify correlations within KPI data. This allows organizations to address potential issues early and explore opportunities for improvement. With its ability to integrate with multiple data sources, Tableau is a great fit for businesses managing complex, multi-source data environments.
Power BI
Microsoft Power BI brings enterprise-level KPI benchmarking to the table, seamlessly integrating with the Microsoft ecosystem. It turns data into dynamic dashboards, enabling real-time KPI monitoring - essential for industries that move quickly. Advanced data modeling tools support complex KPI calculations, while automated alerts flag performance issues as they arise. Additionally, its natural language query feature makes data exploration more accessible, catering to users with varying levels of technical expertise.
Klipfolio
Klipfolio specializes in consolidating KPI data from multiple platforms into clean, user-friendly dashboards. With pre-built templates and a wide range of connectors, it minimizes setup time, allowing teams to start tracking metrics almost immediately. Automated reporting ensures stakeholders stay informed about performance trends, while its flexible integration options work with everything from marketing tools to financial systems, making it suitable for diverse tech environments.
Databox
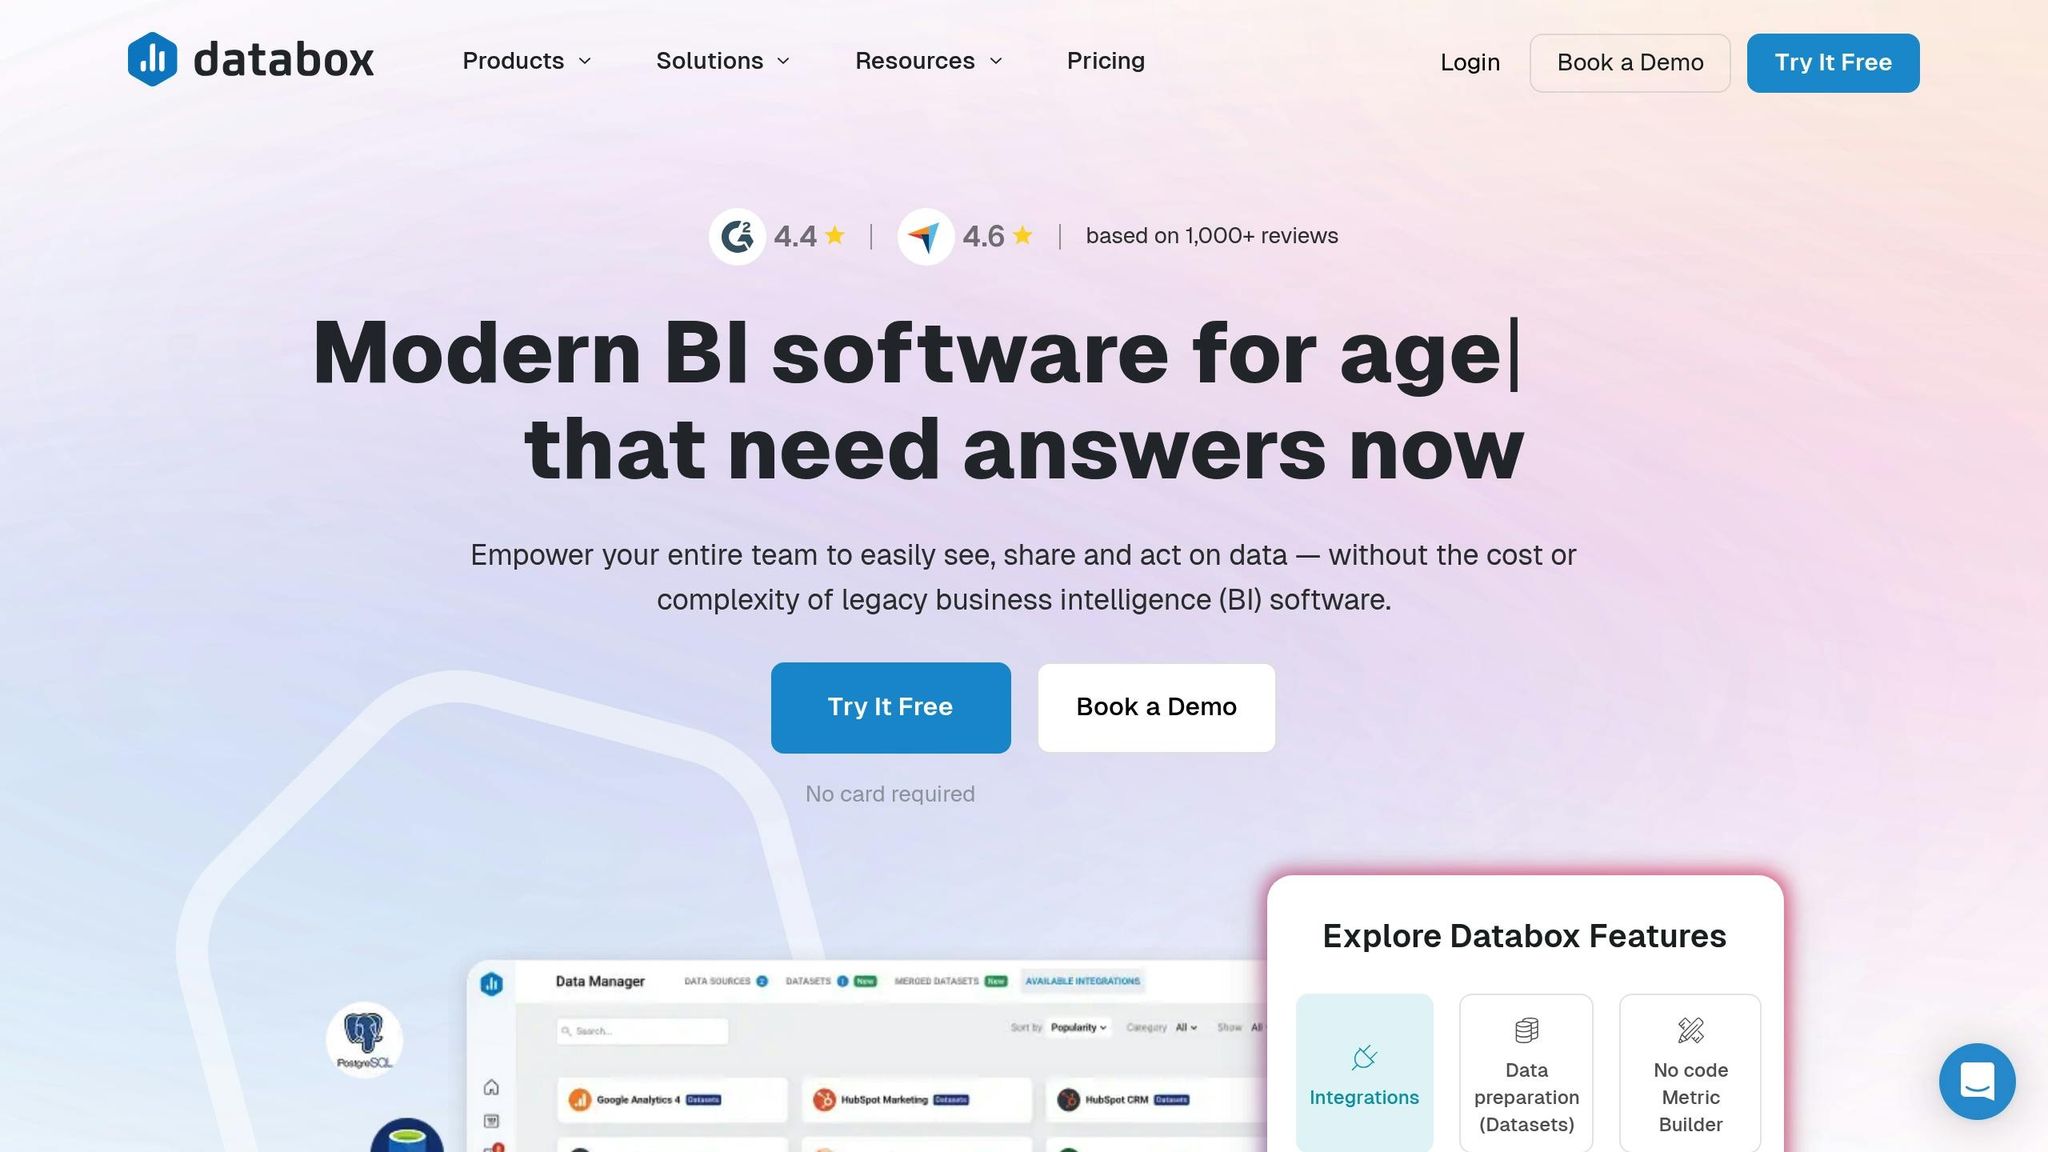
Databox focuses on delivering actionable insights through dashboards designed for simplicity and clarity. Its mobile-first approach and push notifications ensure stakeholders stay updated on key KPIs wherever they are. The platform integrates with numerous business tools and includes goal-setting features that help teams define clear targets and visually track progress. Its combination of accessibility and ease of use makes Databox an excellent option for teams looking for straightforward KPI tracking without unnecessary complexity.
sbb-itb-5174ba0
Tool Comparison
Selecting the right KPI benchmarking tool hinges on your specific business needs, budget, and technical preferences. Each platform shines in its own way - whether you value advanced analytics, simplicity, or the ability to grow with your business.
Here’s a quick breakdown to help you compare the options side by side:
Comparison Table
| Tool | Key Features | Pricing Tier | Integration Capabilities | Best Fit Business Size | Main Advantages |
|---|---|---|---|---|---|
| monday work management | Combines project management with KPI tracking, offering intuitive visuals and automation | Affordable subscription options | Integrates with popular productivity and collaboration tools | Small to medium businesses | Easy-to-navigate interface and flexible design |
| Tableau | Advanced data visualization, interactive dashboards, and trend analysis | Premium pricing | Extensive connectors for diverse data sources | Medium to large enterprises | High-powered analytics and detailed visuals |
| Power BI | Real-time monitoring, natural language queries, and smooth Microsoft integration | Budget-friendly for Microsoft users | Deep integration within the Microsoft ecosystem | Medium to large enterprises | Strong security and AI-driven insights |
| Klipfolio | Customizable dashboards and pre-built templates for consolidating data | Mid-range solutions | API-based connectors for seamless data integration | Small to medium businesses | Quick setup and user-friendly features |
| Databox | Focuses on mobile-first design with goal tracking and push notifications | Flat-rate pricing | Connects with widely used business tools | Small to medium businesses | Mobile-friendly and actionable insights |
This table highlights the standout features of each platform, making it easier to identify the tools that best suit your business size and needs. Smaller teams might lean toward tools with simple setups, while larger organizations may prioritize secure, scalable systems. These platforms are designed to simplify KPI benchmarking, helping you make better-informed business decisions.
Conclusion
Choosing the right KPI benchmarking tool can have a big impact on your business's performance and growth. The tools we've discussed - monday work management, Tableau, Power BI, Klipfolio, and Databox - each bring their own strengths to the table, designed to meet the needs of businesses of all sizes. Whether you're a small startup that values user-friendly dashboards or a large enterprise in need of advanced analytics, there's a solution out there that aligns with your goals and budget.
The most important step is identifying what your business truly needs. A tool that works well for a small 10-person marketing team might not scale effectively for a company with 500 employees, and vice versa. In 2025, data-driven decision-making is no longer optional - it's essential. Businesses that benchmark their KPIs consistently outperform those relying on intuition or outdated metrics. The right tool can turn raw data into insights you can act on.
For those seeking more options, the Marketing Analytics Tools Directory is a valuable resource. It categorizes and compares leading marketing analytics tools, data solutions, and professional services, simplifying the process of finding the right match for your unique needs. Whether you're focused on real-time analytics, campaign tracking, or building robust reporting dashboards, this directory supports businesses of all sizes in optimizing their strategies through smarter data use.
Ultimately, the best tool is the one your team will actually use. Prioritize solutions that balance powerful features with ease of use, so your investment in analytics technology delivers real, measurable results. By taking a thoughtful approach to KPI benchmarking, your business can continually refine its strategies and achieve sustained growth.
FAQs
How can I choose the best KPI benchmarking tool for my business needs?
To pick the best KPI benchmarking tool for your needs, start by considering your business size, objectives, and how complex your data is. Small businesses usually benefit from straightforward, budget-friendly tools that are easy to set up and come with user-friendly dashboards. Meanwhile, larger companies or those dealing with intricate data might need more advanced platforms that offer greater customization, scalability, and integration options.
Choose a tool that aligns closely with the KPIs you’re tracking - whether they’re financial, operational, or customer-related. Look for features like real-time analytics, robust reporting capabilities, and seamless integration with your existing systems. These elements can help ensure the tool delivers meaningful insights and adds real value to your operations.
How do Tableau and Power BI compare when working with large datasets?
In 2025, Tableau stands out as a top choice for working with large datasets. Its advanced data engine and quick rendering make it a go-to tool for businesses dealing with extensive and complex data. The platform is built to handle these challenges with ease, offering smooth performance and minimal lag during big data analysis.
On the other hand, Power BI is a reliable and versatile option, though it may need extra configuration or optimization to manage very large datasets efficiently. While it can sometimes slow down with substantial data models, Power BI remains an attractive solution - especially for organizations already using Microsoft's suite of tools or looking for a more cost-effective alternative.
Why is mobile accessibility crucial for KPI benchmarking tools, and which ones are best for small teams?
Mobile accessibility plays a key role when it comes to KPI benchmarking tools, particularly for small teams. It allows team members to work remotely with ease, receive real-time updates, and make quicker decisions no matter where they are. With mobile-friendly tools, teams can stay connected and keep an eye on performance metrics without being confined to their desks.
Certain tools shine in this area. For instance, Databox provides user-friendly mobile dashboards, making it simple to track KPIs on the move. Meanwhile, Userpilot Mobile Analytics offers smooth mobile integration, ensuring efficient monitoring of performance metrics. These tools empower small teams to remain nimble and responsive in fast-paced work settings.