Most teams do not need more scores - they need proof that scores change pipeline, win rate, forecast accuracy, or EBITDA. My read is simple: pick the best analytics tools for business based on the gap you need to fix first, then measure lift with holdouts and tie results back to bookings, margin, and cost.
If I boil the article down, it says 3 things:
- Use CRM-native tools like Salesforce, HubSpot CRM, HubSpot Sales Hub, Aviso, and Revenue Grid when the main issue is deal priority and forecast calls
- Use activation tools like Hightouch and Braze when the main issue is getting segments into sales, ads, or lifecycle channels
- Use behavior tools like Amplitude, Klaviyo, and Optimove when the main issue is product use, retention, renewal, or expansion
- Use account-priority tools like 6sense and Terret when the main issue is which accounts to work now
- Use engagement-layer tools like Mediafly Revenue360 when the main issue is buyer activity inside open deals
Before I trust any of these platforms, I would check 4 basics:
- clean CRM stages
- linked account and contact IDs across systems
- enough closed-win and closed-loss history
- a clear path from segment entry to revenue and finance results
Without that, the model may score bad process instead of buyer behavior.
Quick comparison
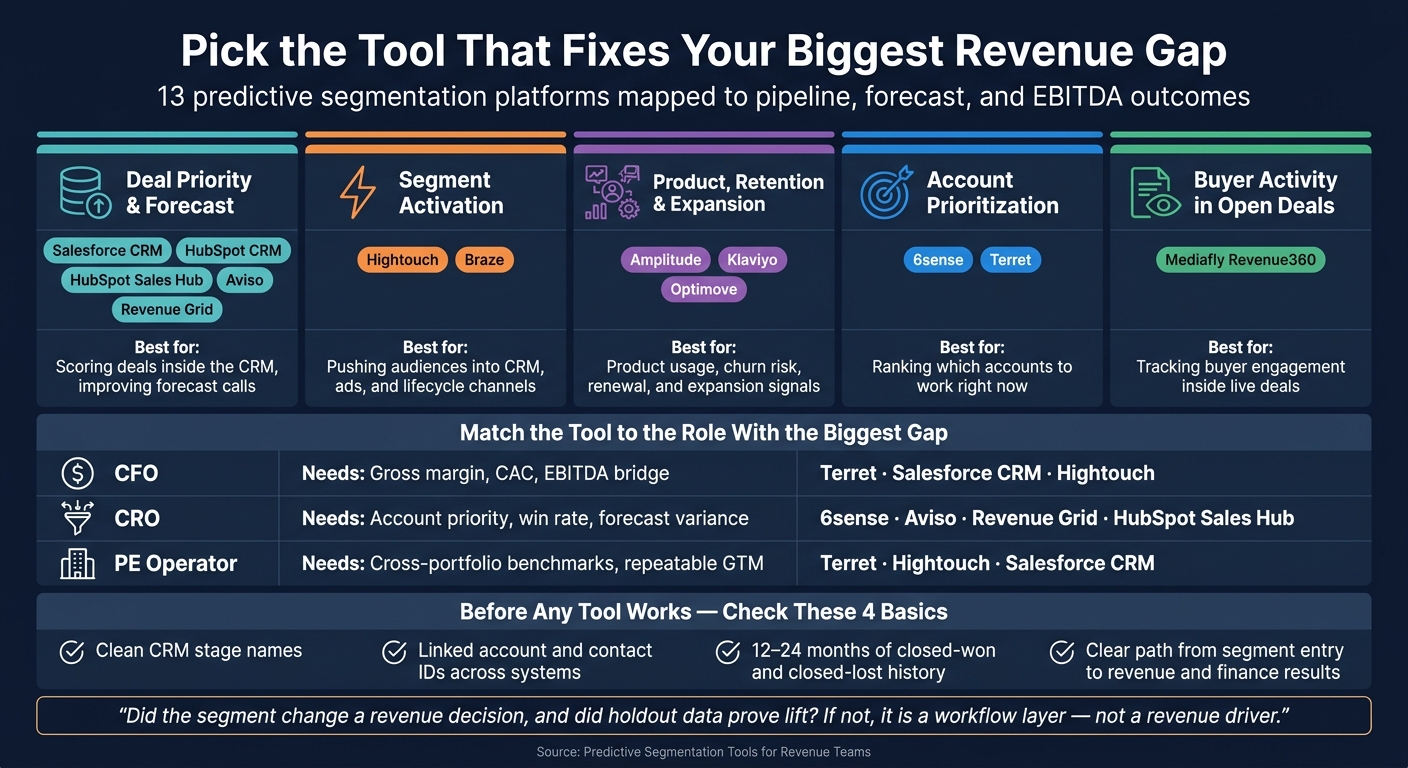
Predictive Segmentation Tools Compared: CFO, CRO & PE Use Cases
| Tool | Best for | Main input | Best business use | Watch-out |
|---|---|---|---|---|
| 6sense | Account ranking | Intent + CRM data | Prioritize accounts and improve coverage | Needs clean account matching |
| Hightouch | Segment activation | Warehouse scores and traits | Push audiences into CRM, ads, and lifecycle tools | Does not build the model |
| Salesforce CRM | CRM-based scoring | Opportunity history and CRM fields | Deal priority and forecast reviews | Needs enough won deals and clean stages |
| HubSpot CRM | Lighter all-in-one CRM scoring | Fit, engagement, and predictive scores | Routing, scoring, and reporting in one place | EBITDA still needs finance data |
| Amplitude | Product-led signals | Product events and cohorts | Expansion, conversion, and churn signals | Not a forecast tool |
| Braze | Lifecycle activation | Behavioral and CRM signals | Journey execution across channels | Scoring usually comes from elsewhere |
| Klaviyo | Retention and repeat purchase | Purchase history, churn, predicted LTV | Win-back, cross-sell, repeat revenue | Weak fit for deal forecasting |
| Optimove | Retention microsegments | Transaction, product, and response data | Save, expand, and reactivate customers | Not built for B2B pipeline stages |
| Aviso | Deal risk scoring | CRM + email + meeting signals | Spot risk sooner in live deals | Depends on communication data quality |
| Mediafly Revenue360 | Buyer engagement in deals | Content and asset engagement | Judge deal momentum and forecast risk | Better as a deal-health layer than a full forecast system |
| Revenue Grid | Activity-based pipeline checks | Emails, meetings, calls, CRM records | Find stalled deals and compare rep view vs activity | Weak data hygiene cuts signal quality |
| HubSpot Sales Hub | AI deal scoring in HubSpot | Deal properties and activity | Deal review queues and forecast checks | Score can mislead if close dates are stale |
| Terret | Revenue and finance readout by segment | CRM, marketing automation, and sales-cycle data | Connect segments to pipeline, win rate, forecast, and EBITDA | Best when segmentation already exists |
My bottom line: one platform rarely covers CFO, CRO, and PE use cases at the same time, even among the top analytics tools. If I were buying today - 09/29/2026 - I would start with the role that has the biggest problem:
- CFO - tie segment results to gross margin, CAC, and EBITDA
- CRO - sort accounts and deals, then tighten forecast variance
- PE operator - standardize definitions across portfolio companies first
The article’s main test is the right one: did the segment change a revenue decision, and did a holdout group prove lift? If the answer is no, it is a workflow layer, not a revenue driver.
sbb-itb-5174ba0
1. 6sense
6sense helps revenue teams focus on the right accounts first. It uses intent signals and predictive account scoring to spot accounts that show buying activity. By combining intent data with CRM data, 6sense ranks accounts by how likely they are to buy. In practice, that means teams can turn account-level intent into prioritized segments instead of just piling up more signals.
Pipeline Linkage
Revenue teams use these scores to prioritize outreach, tie activity to sourced pipeline, and stay focused on accounts with a higher chance of converting. That also gives teams a clearer view of the forecast by separating high-intent accounts from lower-probability pipeline. So the segmentation does double duty - it helps sales decide where to spend time, and it gives leadership a cleaner read on pipeline quality.
Sales teams use the scores to sort accounts into clear buckets:
- accounts that need immediate attention
- accounts that should go into nurture
- accounts that should stay out of active coverage for now
EBITDA Visibility
For CFOs and PE operators, the upside is straightforward: less wasted coverage, better rep focus, and stronger CAC efficiency.
2. Hightouch
If 6sense flags the accounts to watch, Hightouch puts those scores to work. Hightouch sits between the data warehouse and revenue systems. It does not build predictive models or forecasts; it activates warehouse-built segments in Salesforce, HubSpot, Braze, Google Ads, Meta, and other destinations.
Predictive Inputs
The logic lives in the warehouse. Teams can pull together propensity-to-buy or propensity-to-churn scores, product usage, renewal dates, open opportunity stage, engagement recency, and account fit into one audience.
For example, a team might build a segment with a high fit score, a live opportunity, recent inactivity, and an upcoming renewal. That audience can then sync to Salesforce for seller priority and to ad platforms for account-based reach.
Pipeline Linkage
When an account enters or leaves a segment, Hightouch pushes that change to each connected destination automatically. That matters, but measurement still needs discipline. Teams should log audience entry and exit timestamps next to opportunity creation, stage movement, and win rate, then compare exposed accounts with a control group instead of assuming segment membership drove the result.
Imperfect Foods used Snowflake-powered Hightouch audiences across Google, Facebook, and TikTok and reported a 15% reduction in CAC alongside a 53% quarter-over-quarter increase in customer reactivations. [2] Chalhoub activated audiences using Hightouch and BigQuery, reporting a 40% increase in ad revenue and a 30% reduction in CAC. [1]
Forecast Confidence
Hightouch helps improve forecast inputs, not the forecast model itself. By keeping product adoption scores, renewal risk flags, and engagement signals current in the CRM, it cuts down on stale data that can throw off pipeline reviews.
Teams should still watch commit-to-actual variance and stage aging on their own. That is how you tell whether better CRM data is tightening forecast accuracy over time or just making dashboards look busier.
EBITDA Visibility
For CFOs and PE portfolio operators, the warehouse is the right place to tie segment performance to financial outcomes. Because Hightouch activates governed warehouse data, the warehouse or BI layer can join segment results to spend, margin, bookings, retention, net retention, and estimated EBITDA contribution.
For PE operators, consistency matters. Standard segment definitions, identity keys, refresh schedules, and outcome fields make cross-portfolio comparisons easier.
Teams that want this logic inside the system of record move next to CRM-native segmentation.
3. Salesforce CRM
Salesforce CRM keeps predictive scoring where sellers already work - on the opportunity record, in list views, and on the forecast page.[7] That matters because the score lives inside the CRM record and forecast flow, not in warehouse-activated segments. Revenue teams can turn score bands into priority, nurture, and low-touch segments, then tie those segments straight to pipeline, win rate, forecast confidence, and EBITDA.
Predictive Inputs
Salesforce Einstein Opportunity Scoring looks at past closed-won and closed-lost deals to spot patterns linked to wins and losses. Inputs can include opportunity fields, activity history, account attributes, products, quotes, and price books.[3] Scores run on a 1-99 scale.[7] The model needs at least 200 closed-won opportunities from the prior 24 months.[6]
Before turning scoring on, clean up the basics. Audit:
- stage names
- close dates
- duplicate accounts
- stale deals
- currencies
- closed outcomes
If that data is messy, the score will be shaky too.
Pipeline Linkage
Use the score as a segment label, not as a standalone call on what will happen next. Salesforce's Pipeline Inspection and Pipeline Forecasting views group deals into Healthy, Caution, and At Risk categories.[5] The better move is to read score alongside amount, close date, stage, probability, segment, product, owner, and recent activity. A $250,000 At Risk deal due this quarter should rank above a $25,000 deal in the same score tier.
Revenue teams can tie score categories to clear actions. For example:
- flag an At Risk enterprise deal for manager review
- require a next-step date before a stage advance
- route a high-scoring expansion opportunity to both an account executive and a customer success partner
Forecast Confidence
Salesforce forecasts roll up expected sales from a defined set of opportunities, and forecast adjustments let sales teams change the rollup without changing the underlying opportunity record.[4] Pair score categories with stage aging, close-date movement, and past conversion rates by rep and segment. That gives forecast reviews an evidence layer without pushing seller judgment aside.
EBITDA Visibility
For finance, these scores are inputs into contribution margin and EBITDA modeling, not a profit metric on their own. Finance teams can map Salesforce's commercial inputs - contract value, close timing, product mix, segment, discount, and forecast scenario - to product-level gross margins, commission rates, implementation costs, and support costs. That lets them model contribution margin and EBITDA impact by quarter.
4. HubSpot CRM
HubSpot CRM works best for teams that want scoring, routing, and reporting inside the same system they already use for contacts, deals, workflows, and reports. Reps can act on scores without exporting data, which cuts extra steps. Where Salesforce tends to fit large enterprise CRM setups, HubSpot is a better fit for teams that want a lighter stack. The payoff is simple: turn score bands into meeting rate, pipeline creation, and tighter forecast discipline.
Predictive Inputs
HubSpot supports engagement, fit, combined, and predictive scoring.[8] Predictive scoring uses machine-learning analysis of customer properties and activities to estimate the chance that an open contact will convert within 90 days.[14]
Admins can build scores for contacts, companies, or deals, set the rules and point values, define thresholds, and tie the score to CRM properties.[13] A common setup looks like this:
- Add points for target industry, firm size, revenue, and decision-maker title
- Subtract points for poor-fit industries, invalid records, and inactivity
Thresholds should map to past outcomes so only higher-score records become sales-priority signals.
Pipeline Linkage
Scores can feed segments, workflows, and reports without sending data somewhere else first.[8] In practice, teams use score thresholds to route high-priority contacts to SDRs, alert record owners, and create follow-up tasks. From there, they can compare each score band by meeting rate, opportunity-creation rate, win rate, ACV, and sales-cycle length.
HubSpot also tracks opportunity count, deal value, close date, stage, owner, and pipeline movement.[10] That shifts segmentation from basic list management into a working sales process.
Forecast Confidence
HubSpot's forecasting tools group deals into forecast categories and support commit, best case, and pipeline scenarios.[11][12] Predictive scores can act as early-funnel signals, but they still need to prove themselves against actual results. The key checks are forecast-versus-actual revenue, stage slippage, coverage, and win rate.
EBITDA Visibility
HubSpot shows pipeline timing and revenue scenarios, but CFOs and PE operators still need margin, headcount, delivery, and implementation costs from finance systems to model EBITDA.[9][11][12] HubSpot does not produce an EBITDA view on its own. That gives revenue teams a clearer view of pipeline, while finance still needs margin and cost data to tie pipeline to EBITDA.
| Evaluation area | HubSpot CRM approach |
|---|---|
| Predictive input | Likelihood-to-close scoring over a 90-day horizon, plus admin-defined fit and engagement scores[8][14] |
| Segmentation | Scores feed segments, workflows, and reports natively[8] |
| Forecast confidence | Deal-stage categories and scenario forecasting; validate score signals against actual outcomes[11][12] |
| EBITDA visibility | Operational pipeline data; EBITDA requires cost and margin data from finance systems |
| Published pricing | Starter $7/seat/month · Professional $90/seat/month · Enterprise $150/seat/month[15][16] |
Teams that need product-behavior signals next should move to Amplitude.
5. Amplitude
Amplitude uses product events to build behavioral segments that show which users are more likely to convert, expand, or churn. If Hightouch is the tool that activates warehouse-built segments, Amplitude and Mixpanel are the tools that help create the product-behavior signals behind them.
Predictive Inputs
Amplitude supports behavioral cohorts, which show what users have already done, and predictive cohorts, which estimate what they may do next.[17][20] Amplitude case studies show that certain onboarding actions can line up closely with retention. Prediction scores update hourly.[21]
That makes Amplitude a good fit when product usage is a strong lead indicator for expansion, renewal, or conversion.
Pipeline Linkage
When a cohort surfaces high-intent users, revenue teams can send that audience into CRM for follow-up. Amplitude's Salesforce integration brings CRM data together with product behavior, then syncs the cohort to downstream tools so sales teams can act on it.[18][21]
CROs should judge this by business results, not just by cohort creation. The key checks are:
- More meetings booked
- Higher conversion rates
- Better win rates
- Shorter sales cycles
Amplitude's Canal case study reported a 3× increase in app conversion after the team identified its highest-retention usage pattern.[23]
Forecast Confidence
Amplitude adds a product-behavior layer to CRM-based forecasting, but it does not replace the forecast itself. Teams can use these signals to pressure-test late-stage deals and focus on accounts showing stronger product adoption.
Revenue leaders should treat this as one input into forecast judgment, not as a standalone forecast.[17][20]
EBITDA Visibility
Amplitude does not calculate EBITDA directly. Its role is upstream. It helps shape the inputs that feed a finance model - activation rates, renewal odds, expansion signals, and churn risk by cohort.[19]
For a PE portfolio operator, that means you can compare retention and conversion across portfolio companies using the same behavioral definitions, then pass those cohort-level results to finance. From there, finance can map them against recurring revenue, gross margin, support costs, and acquisition spend.
For finance teams, the value stays directional until product data is joined to margin and bookings. Without that link, Amplitude shows correlation, not EBITDA impact.
| Evaluation area | Amplitude approach |
|---|---|
| Predictive input | Behavioral and predictive cohorts built from instrumented product events; scores update hourly[17][21] |
| Segmentation | Cohorts synced to CRM, marketing automation, or customer-success destinations[21] |
| Forecast confidence | Behavioral evidence layer for CRM-stage judgment; not a standalone forecast[17][20] |
| EBITDA visibility | Cohort-level retention and conversion data; EBITDA requires a finance-owned data join |
| Published pricing | Free: 2M events/month · Plus: about $5,388/year at roughly 5M events/month[22][24] |
6. Braze
Braze is the activation layer. It takes warehouse segments and turns them into cross-channel lifecycle journeys.
Predictive Inputs
Braze activates predictive segments across email, SMS, push, and in-app using behavioral and CRM signals.[25]
Pipeline Linkage
Teams use attribution and multi-touch attribution to compare exposed and control cohorts. Then they connect Braze-driven journeys to pipeline influence, conversion, and win rate.
EBITDA Visibility
For CFOs and PE operators, Braze helps when journey lift can be tied back to revenue, retention, and margin through the finance stack.
That means Braze handles activation, not predictive scoring.
7. Klaviyo
Klaviyo fits revenue teams that run a marketing-led retention model. It starts with customer behavior, not sales pipeline data. Its strength is using transaction history to sort customers by likely value and churn risk. That works well when purchases are the main signal. It is less useful when forecast accuracy depends on deal stage, rep activity, or CRM opportunity data.
Predictive Inputs
Klaviyo predicts customer value using purchase history, predicted LTV, and churn risk.
Pipeline Linkage
For revenue teams, the day-to-day use case is lifecycle revenue, not pipeline review. Teams can use these segments to power:
- replenishment flows
- win-back campaigns
- cross-sell motions
- VIP programs
Klaviyo helps support repeat revenue and retention. It does not function like a CRM-based opportunity forecasting tool.
EBITDA Visibility
For CFOs, the core question is simple: does predicted repeat revenue make up for churn and protect margin? Predicted LTV and churn risk can help teams estimate repeat revenue, check retention health, and spot margin pressure early. Finance still needs cost and margin data to translate those signals into EBITDA.
8. Optimove
Optimove is built for lifecycle and retention work, not purchase-led email alone. It pulls together transactional, product, and response data from top website analytics tools to create live microsegments.[29][30]
Predictive Inputs
Optimove uses models to estimate churn risk, reactivation potential, conversion likelihood, next purchase date, and 12-month future customer value.[28][31] In practice, that means teams can sort customers using lifecycle stage, recency, frequency, spend, and predictive scores at the same time. The point is simple: a high-value customer with churn risk should not be treated the same way as a low-value inactive buyer.
Pipeline Linkage
Optimove is aimed at retention, lifetime value, and campaign orchestration, not standard B2B opportunity tracking.[26][27] It is not a replacement for CRM opportunity stages or deal forecasting.
Its use for revenue teams sits inside the current customer base. It helps answer 3 practical questions:
- Who is worth saving
- Who is ready to expand
- Who is likely to respond to a given offer
Teams can export segment labels, churn scores, future-value scores, campaign exposure, and response data into the CRM or data warehouse. From there, they can map those outputs to renewals, expansions, bookings, gross retention, net revenue retention, and win rates. That makes Optimove useful for renewal and expansion priority setting before anything gets pushed into a forecast.
Forecast Confidence
Use Optimove's predictions as inputs to a forecast, not as the forecast. Check results by cohort against actual outcomes, test incremental lift with a control group, and set clear attribution windows before those outputs show up in formal planning.
EBITDA Visibility
Start by converting retained or expanded revenue into contribution margin, then into EBITDA after campaign, incentive, data, and operating costs. Keep modeled LTV, attributed revenue, incremental revenue, and EBITDA contribution separate. That way, finance and marketing are working from the same definitions. Finance still owns the margin bridge.
9. Aviso
Aviso goes past CRM record data. It adds live communication and meeting signals to flag deal risk earlier. Aviso sorts live deals by win likelihood and risk, so revenue teams can see which opportunities to push, rescue, or deprioritize.
Predictive Inputs
Aviso's AI engine reads email sentiment, meeting cadence, calendar activity, and stakeholder engagement alongside structured CRM data. It rolls those signals into a real-time deal score for each opportunity.
That score then turns into a deal-level segment map for sales managers and forecast calls.
Pipeline Linkage
Aviso ties deal-level risk signals straight to total pipeline coverage, sorting opportunities into healthy, at-risk, and stalled deals. It flags inactive deals before they skew the forecast. Teams can use the score to route healthy deals, escalate at-risk deals, and close out stalled deals before they inflate coverage.
Forecast Confidence
Live deal behavior signals show risk earlier than stage-based scoring on its own. That gives CROs and frontline managers one view that links communication activity to deal outcomes, with pipeline coverage, win rate, and forecast confidence tied to signals that update as deals move.
EBITDA Visibility
For CFOs and PE operators, Aviso improves forecast reliability and planning accuracy. Cleaner forecast data supports board reporting and EBITDA planning.
10. InsightSquared / Mediafly Revenue360
Mediafly Revenue360 uses buyer content engagement to segment open deals, flag risk, and improve forecast accuracy.
Predictive Inputs
Aviso leans on communication signals. Revenue360 leans on content engagement. Its main input is asset engagement - how prospects interact with decks, proposals, and videos. Teams use that data to group deals into segments like engaged buyers, stalled deals, and high-intent accounts.
Pipeline Linkage
This matters because it helps teams tell active buyers from deals that have gone cold. Revenue360 tracks deal velocity by comparing engaged deals with inactive ones. It also ties engaged cohorts to deal velocity, win rate, and influenced revenue. In plain terms, teams can see how buyer engagement connects to pipeline movement.
Forecast Confidence
Revenue360 shows which deals still have active buyer engagement and which ones have stopped. CROs use those cohorts to spot risk early and focus manager attention before stalled deals throw off the forecast. CFOs use the same view to tighten forecast variance. That makes the forecast more dependable than stage data alone, because it reflects actual asset engagement instead of rep-reported stage movement.
Planning Visibility
For PE operators, engagement patterns can be compared across portfolio companies to judge pipeline quality with the same lens. For CFOs, Revenue360 turns pipeline and engagement data into inputs for revenue and cash planning. That cuts forecast risk from deals that look active in CRM but have stopped engaging in the market.
Teams that need the next step after engagement scoring move from measurement to workflow and activation.
11. Revenue Grid
Revenue Grid tracks seller activity inside Salesforce and turns it into deal signals. It captures sales emails, meetings, and calls, then uses that activity to help teams rank deals, accounts, and next steps in CRM.[32]
Predictive Inputs
Revenue Grid runs on a simple set of inputs: emails, calendar events, meetings, calls, and Salesforce opportunity records.[35][32] It looks at those signals to see whether the expected buyer and seller activity is happening and whether a deal is moving through its stages the way it should.[33]
The catch is CRM hygiene. If stages are inconsistent, calls go unlogged, or close dates are wrong, the risk alerts get weaker. In other words, the system can only judge the pipeline based on what the pipeline actually shows.
Pipeline Linkage
After it captures activity, Revenue Grid checks that activity against the deal status reported in Salesforce. So if a late-stage opportunity has little or no recent buyer interaction, it stands out as a risk instead of sitting in the pipeline as if nothing is wrong.
That gives managers a better way to spot stalled deals before they turn into forecast misses. CROs can use this in deal reviews by flagging stalled deals, looking at the interaction history, and assigning a specific next step instead of relying only on a rep's verbal update.
Forecast Confidence
Revenue Grid combines AI, historical deal patterns, and live pipeline activity to produce explainable revenue projections.[33] For CROs, the practical use is clear: it separates 3 views that often get blurred together - what reps say will close, what the captured activity supports, and what remains after stalled or weakening deals are adjusted out.
For CFOs, that gap matters. It gives them a way to push back on forecast optimism that isn't backed by activity before it flows into quarterly bookings or cash planning. Teams that want the same CRM-native logic with broader workflow scoring move next to HubSpot Sales Hub.
EBITDA Visibility
Revenue Grid does not calculate EBITDA natively and is not a financial planning tool. For CFOs and PE operators, the use case is cleaner pipeline inputs for margin and EBITDA models. Standardized pipeline-health labels also make it easier to compare companies across a portfolio when CRM process stays consistent.[34][36]
12. HubSpot Sales Hub
HubSpot Sales Hub puts AI deal scoring and forecasting inside the CRM, so pipeline review and rep follow-up happen in the same place. For teams that want scoring tied straight to rep activity and forecast calls, that’s the main draw.
Predictive Inputs
Deal score is not the same as stage probability. It uses deal properties and activity to estimate the chance of closing.[37] Before you lean on that score, get the basics clean: deal amount, close date, stage, next activity, owner, and loss reason. If activity is stale or the close date is wrong, a high score can give managers the wrong read.
Pipeline Linkage
Deal scores show up right in the CRM deals view, which lets managers sort and filter by score next to stage, amount, owner, and close date.[37] HubSpot also supports 3 deal amount views: total amount, weighted amount, and forecast amount.[38]
Use each one for a different job:
- Total amount for gross pipeline
- Weighted amount for probability-adjusted pipeline
- Forecast amount for the management view
A good operating model is to turn scores into review queues. For example, flag:
- high-value deals with a low score
- high-score deals with no documented next step
- deals closing within 30 days with no recent engagement
That shifts deal scoring from a passive dashboard number to a working action list.
Forecast Confidence
Forecast review is where you check whether high scores are turning into actual pipeline movement. HubSpot forecasting includes Pipeline, Best case, Commit, and AI projections. Used with deal scores and rep commits, those views can help surface forecast risk. Forecast-submission flags also show which reps are overdue for updates, so managers can catch holes before the review meeting.[38]
For CROs, one of the best weekly habits is to compare 3 signals side by side: stage-weighted pipeline, deal-score distribution, and rep-submitted commit amounts. When those numbers pull apart, that gap usually points to forecast risk.
EBITDA Visibility
For CFOs and PE operators, the practical move is to export forecast data into a finance system and apply margin assumptions by segment to estimate EBITDA impact.[39][40] If you’re working across a portfolio, standard definitions matter first - pipeline, forecast, bookings, revenue, gross profit, and EBITDA need to mean the same thing across companies before any benchmarking says much. That keeps HubSpot useful for finance without asking it to act like a full planning system.
13. Terret
Terret connects CRM, marketing automation, and sales-cycle data to rank target accounts and tie segment performance to pipeline, win rate, forecast confidence, and EBITDA. It fits teams that already segment demand but still need a clean readout on revenue and finance.
Predictive Inputs
Terret pulls in CRM, marketing automation, and sales-cycle data to build priority segments before accounts enter the active pipeline. The result is a ranked list of target accounts tied to expected revenue outcomes, not just engagement signals.
Revenue and Finance Outcomes
The point is not scoring by itself. The point is whether those segments change revenue results. For CROs and PE operators, Terret helps connect segment performance to pipeline created, win rate, forecast accuracy, and EBITDA. It is most useful for teams that already have segments and need those segments translated into revenue and finance metrics.
Comparison by Criteria: CFOs, CROs, and PE Operators
The clearest way to compare these platforms is by what they improve: targeting, forecast, or EBITDA visibility. That framing helps separate activation tools from forecasting tools.
Start with the data source. A platform usually does 1 of 3 things:
- predicts with its own model
- enriches outside signals
- activates data you already have
That distinction matters because forecasts only hold up when CRM data is clean. You need standardized stages, steady account IDs, and enough closed-won and closed-lost history. Once you know where the input comes from, the next check is simple: does the tool change pipeline behavior?
For CROs, a score means little if it doesn’t change which opportunities get attention or how often deals convert. Compare tools based on whether they improve coverage, conversion, win rate, cycle time, and forecast quality. That shifts the discussion from signal generation to forecast reliability.
Pick tools that keep forecast history and compare predictions with actual bookings. One benchmark is worth watching: accuracy below 75% is a warning signal. After that, the last test is whether the output can be tied back to finance metrics.
EBITDA visibility is the hardest use case because it needs data tied across systems. It depends on linking segment performance to spend, revenue, gross margin, and operating cost.
The matrix below shows what each role needs most.
| Role | Primary question | Preferred predictive input | Required output | Operating cadence | Validation metric |
|---|---|---|---|---|---|
| CFO | Which segments and channels create profitable, forecastable growth? | CRM pipeline and bookings, source/campaign cost, gross margin, CAC, retention, and forecast history | Spend-to-revenue-to-EBITDA bridge; scenario view; variance explanation | Monthly close and quarterly planning, with weekly exception alerts | Forecast accuracy, CAC payback, gross-margin contribution, EBITDA impact |
| CRO | Which accounts and opportunities should sales pursue now, and what will close? | Intent, ICP fit, engagement, opportunity age, stage progression, rep activity, and historical win/loss data | Prioritized accounts, next-best actions, pipeline coverage, and commit/best-case forecast | Weekly pipeline review; daily seller alerts | Win rate, stage conversion, sales-cycle time, pipeline coverage, forecast accuracy |
| PE portfolio operator | Which repeatable GTM interventions can improve revenue quality and EBITDA across portfolio companies? | Standardized CRM fields, source attribution, cohort economics, forecast-versus-actual history, headcount, and unit economics | Cross-portfolio scorecard, value-creation plan, and board-ready EBITDA bridge | Monthly portfolio review; quarterly operating plan and board reporting | Forecast accuracy, marketing-sourced pipeline ROI, CAC payback, EBITDA contribution, data completeness |
One platform rarely covers all 3 roles well. Pick the role with the biggest gap first - forecast reliability, pipeline visibility, or EBITDA translation - and choose the platform that closes that gap.
Pros, Cons, and Implementation Requirements
A segment only matters if it changes revenue results. Scoring and activation are table stakes. The hard part is proving that the segment moves pipeline, win rate, forecast confidence, and EBITDA. None of that works without clean CRM and revenue data.
| Validation layer | Key strength | Key limitation |
|---|---|---|
| Revenue/GTM intelligence platforms | Unify website behavior, leads, and CRM revenue into a single view for pipeline and win-rate testing | Still depend on clean CRM stage definitions and consistent account IDs |
| Incrementality measurement platforms | Use holdout-style lift testing to isolate true segment impact from natural demand | Require disciplined experiment design and enough volume to compare groups |
| Financial analytics platforms | Connect segment performance to cash flow and valuation for CFO and PE reporting | Only works when the underlying data and margin assumptions are reliable |
| Forecasting and planning tools | Model revenue and cost changes before scaling a segment | Outputs are only as good as the data and assumptions behind them |
| Data unification and warehouse-native activation | Reduce data silos and support segment-level measurement | Often need engineering support and validation before go-live |
The operating rule is the same across every layer: clean data first, then holdout testing. If the data is messy, the readout will be messy too. Before launch, verify:
- stage names
- account IDs
- at least 12 months of closed-won and closed-lost history
After launch, compare win rates and pipeline movement for accounts in the predictive segment against a holdout group that got no prioritization. That side-by-side view tells you whether the segment is doing work or just riding natural demand.
Once you see lift, turn it into numbers finance can use. The math is straightforward: incremental revenue × gross margin − incremental campaign and labor cost = gross profit contribution. Then subtract added operating expense to estimate EBITDA impact.
The go/no-go test is simple. Did the segment change a revenue decision, and did holdout data prove lift? If not, don't scale it. If yes, you have a case the CFO and PE operator can use.
Conclusion
Pick the tool that moves your main revenue metric. The right choice is the one that can show lift in pipeline, win rate, forecast confidence, net revenue retention, or EBITDA. That shifts the decision away from feature checklists and toward one thing: does this segment change revenue behavior?
Only buy tools that tie segments to bookings, margin, and EBITDA with clean attribution, automated activation, and holdout testing. If a platform can’t show incremental lift, it’s a workflow tool - not a revenue system. If the lift is there and the data is clean, scale it. If not, stop. CFOs need margin proof, CROs need pipeline and win-rate lift, and PE operators need repeatable cross-portfolio benchmarks.
FAQs
How do I choose the right predictive segmentation tool for my team?
Start with the goal. Define the conversions you want to improve, then look hard at your team’s technical skill level and data maturity. That step cuts out a lot of bad-fit tools early.
Next, pick tools that connect cleanly with your CRM, web analytics, and the rest of your marketing stack. If the data lives in separate places, you’ll struggle to get one customer view and act on it.
It also helps to look for AI-driven features such as propensity scoring, along with room to scale, security compliance, and real-time dashboards. For side-by-side research, you can compare features, pricing, and user reviews in the Marketing Analytics Tools Directory.
What data do we need before using predictive segmentation?
Before you use predictive segmentation, get your data house in order. It only works well when you have clean, connected data and one shared view of each customer.
Pull in data from the touchpoints that matter most - your CRM, website analytics, email platform, and social channels. Add audience or seed lists, event data like visits, clicks, and purchases, plus profile attributes.
Then clean it up. That means:
- removing duplicate records
- fixing errors
- filling in missing fields
- using the same format across sources
If one system says "CA" and another says "California", or one tool tracks a purchase under a different customer ID, your segments can drift off course fast. The goal is simple: make sure each customer record is as complete and consistent as possible.
How can we prove segmentation actually improves revenue?
Track the metrics that tie straight to business results: conversion rate, ROAS, CPA, and CLV growth. Then compare segmented, personalized campaigns against generic, non-segmented campaigns to see if segmentation is doing its job.
Don’t stop at top-line campaign numbers. Use A/B testing and multi-touch attribution to isolate impact and link targeting to closed deals, pipeline velocity, and win rates. Just as important, review segments against actual customer behavior on a regular basis. That helps you spot underperforming groups, tighten targeting, and improve ROI.