APIs under pressure can fail when you least expect it. Real-time scalability testing ensures your APIs handle fluctuating traffic, maintain performance, and meet SLAs, even during peak demand.
Here’s what you need to know:
- Why it matters: Scalability testing prevents system failures during high-traffic events like flash sales or viral campaigns. It ensures APIs maintain low latency, high throughput, and minimal errors.
- Key challenges: Rate limits, database connection exhaustion, and high tail latency (e.g., p95/p99) often surface under heavy load.
- How to plan: Set clear goals tied to business outcomes, like latency targets (
p95 < 300ms) or error thresholds (<= 0.5%). - Testing approach: Model traffic patterns, simulate dynamic loads (ramp-up, steady-state, spikes), and use tools like k6 or Gatling for efficient execution.
- Monitoring tools: Use metrics, logs, and traces with solutions like Prometheus and Grafana to diagnose bottlenecks in real time.
- Automation: Integrate scalability tests into CI/CD pipelines, and validate performance with Optimizely's experimentation platform or canary and blue-green deployments in production.
Bottom line: Scalability testing isn’t optional. It’s how you protect revenue, ensure data accuracy, and deliver a reliable user experience during high-stakes events.
API Load Testing Strategies with Harsh Upreti
sbb-itb-5174ba0
Planning Scalability Tests for API Frameworks
Effective scalability testing doesn’t begin with tools - it starts with a solid plan. Without clear objectives tied to business outcomes, teams risk wasting time interpreting metrics that may not even matter.
"Define success criteria first. Otherwise, teams end up staring at graphs and arguing about whether the result matters." - Kristian Razum, LoadTester [3]
Setting Business-Driven Scalability Goals
The best scalability goals link technical metrics directly to business risks. For example, Amazon’s research shows that every 100ms of latency can reduce sales by 1% [9]. This highlights why response times should be viewed as revenue drivers, not just technical benchmarks.
To create meaningful goals, map critical user journeys to measurable Service Level Indicators (SLIs) and set Service Level Objectives (SLOs). These can be defined in test scripts or YAML configurations. For instance:
- Checkout API:
p95 < 300ms,error_rate <= 0.5%[8]
Here’s a breakdown of key performance metrics and why they matter:
| Metric | Example Acceptance Criteria | Why It Matters |
|---|---|---|
| p95 / p99 Latency | p95 < 300ms, p99 < 1,200ms |
Reflects the experience of the slowest users [8] |
| Throughput (RPS) | Sustained >= target TPS |
Ensures the system can handle business demand [8] |
| Error Rate | <= 0.5% |
Detects user-facing failures quickly [8] |
| CPU / Memory | CPU < 70%, Memory < 80% |
Prevents resource saturation [8] |
| DB Connection Pool | <= 80% utilization |
Identifies bottlenecks in external systems early [8] |
Once these goals are in place, the focus shifts to understanding the technical factors that could affect these metrics.
Identifying Scalability Factors in API Integrations
With measurable targets in hand, the next step is to pinpoint the internal and external factors that influence performance.
Rate limits are one key consideration. For example, HubSpot imposes a limit of ~19 RPS, while Salesforce restricts concurrent requests [10]. These limits require testing throughput on a per-tenant basis rather than evaluating raw platform speed.
Other common challenges include database connection pool exhaustion and OAuth token lifecycle management. Proactively refreshing tokens before they expire - rather than waiting for a 401 error - can prevent sync failures caused by race conditions in background jobs.
In microservices architectures, latency can also become a significant issue. While a single transfer in a monolithic system might take 1 microsecond, the same transfer in a microservices setup could take 1,000–5,000 microseconds due to network overhead [11]. Factors like inter-service hops, TLS handshakes, and middleware layers compound under load.
Translating Real-World Traffic Into Test Scenarios
To ensure scalability tests are realistic, it’s crucial to model real-world traffic patterns accurately.
Incorporating realistic think time into tests prevents artificially inflating system load [12]. Use production logs to calculate your Peak Hour Factor (PHF) with this formula:
PHF = Transactions in busiest 60-minute window / Total daily transactions
For enterprise SaaS platforms, PHFs often range between 0.20 and 0.30, meaning up to 30% of daily traffic could occur within a single hour [12]. From there, calculate peak throughput using:
Peak TPS = (Daily Transaction Volume × PHF) / 3600
Additionally, apply a growth factor of at least 1.20 to account for traffic increases three to six months after testing [12]. For marketing API integrations, test at least the top five to seven transaction types, rather than focusing on a single endpoint, to better simulate cache and database behavior under mixed workloads.
Implementing Dynamic Traffic Simulation for Scalability Testing
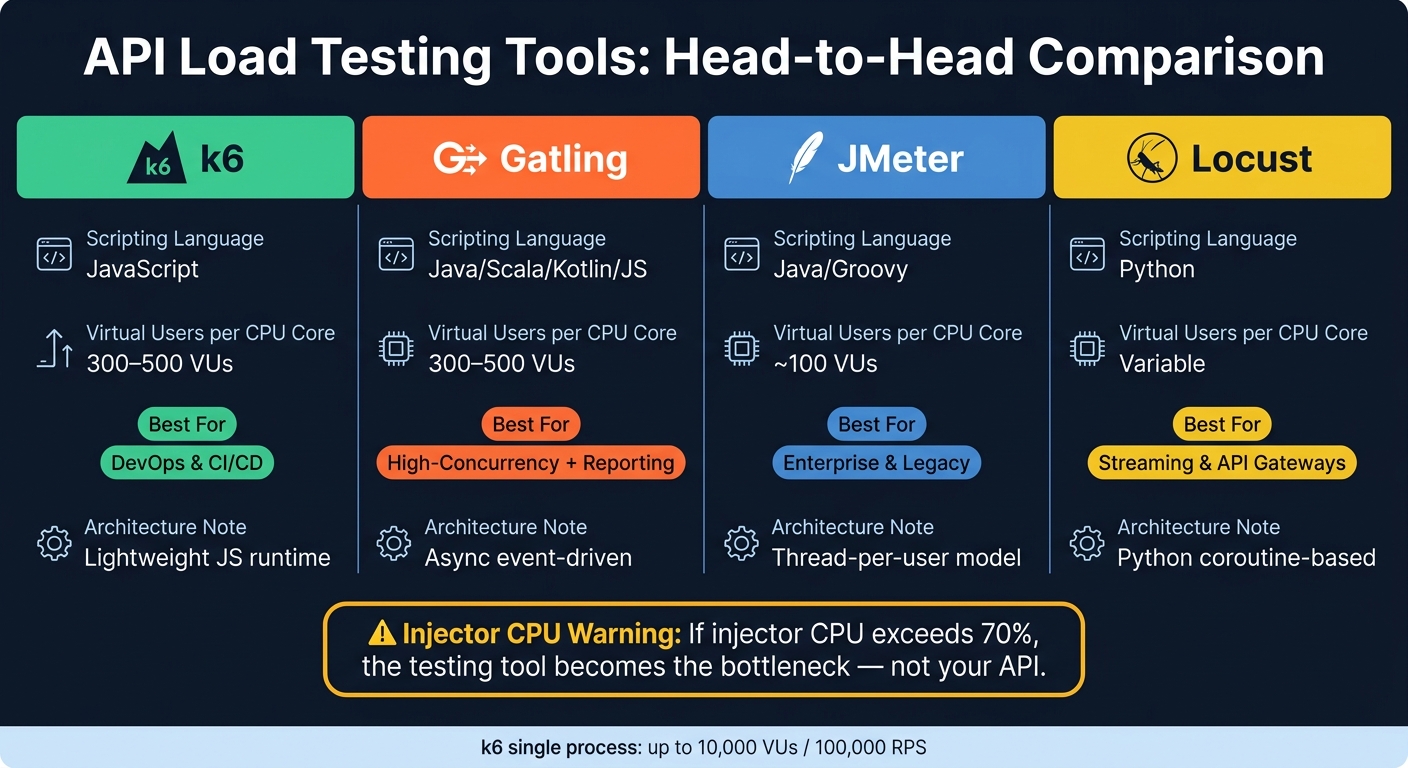
API Load Testing Tools Compared: k6 vs Gatling vs JMeter vs Locust
This phase takes your calculated peak Transactions Per Second (TPS) and workload models and transforms them into dynamic simulations. It’s a crucial step to ensure your testing reflects how APIs behave in real-world scenarios. Once you’ve nailed down your workload model and peak TPS targets, the next task is to simulate actual user behavior. This simulation bridges the gap between planning and hands-on testing by creating load profiles that mimic real usage patterns.
Designing Realistic Dynamic Load Profiles
Flat load profiles, where all users interact simultaneously, don’t reflect real-world traffic. Instead, injection profiles are a better option as they replicate actual user behavior. Using your earlier traffic models, you can create dynamic load profiles with three key phases:
- Ramp-up: Gradually increase the load to prevent the "thundering herd" problem when the test begins.
- Steady-state: Maintain peak load levels to assess SLA compliance over time.
- Spike: Introduce sudden surges of high concurrency to test how well your system handles viral events or flash sales.
"Most performance tests fail before a single request is sent... because the workload model is wrong." - Santhosh Kumar Jampala, Performance Engineer [12]
To determine the number of virtual users (VUs) needed for your simulation, use Little’s Law: N = X × R, where N is the number of concurrent users, X is the requests per second, and R is the average response time [12][1]. This formula ensures your concurrency levels match real-world conditions instead of relying on guesswork.
Additionally, incorporate data feeders - such as CSV or JSON files - to provide varied data inputs like unique identifiers, session tokens, or product IDs [14][15]. Without dynamic data, repeated cached requests can lead to misleading results by hiding actual bottlenecks.
Once your load profile is ready, leverage cloud-native tools to efficiently execute these scenarios.
Using Cloud-Native Load Testing Tools
The choice of tool plays a big role in determining how many virtual users you can simulate per machine. For example:
- JMeter handles about 100 VUs per CPU core.
- Gatling and k6 can simulate between 300–500 VUs per core [12].
Keep an eye on injector CPU usage - if it exceeds 70%, your testing tool might become the bottleneck instead of the API.
| Tool | Scripting Language | Best For |
|---|---|---|
| k6 | JavaScript | DevOps/CI/CD integration, fast execution [1][13] |
| Gatling | Java, Scala, Kotlin, JavaScript | High-concurrency testing with detailed reporting [1][16] |
| JMeter | Java/Groovy | Enterprise teams and legacy systems [1] |
| Locust | Python | Complex scenarios like streaming or API gateways [5][2] |
"Gatling's asynchronous, event-driven architecture can simulate millions of users while using a fraction of the CPU and memory of traditional thread-per-user tools." - Gatling.io [16]
Incorporating Regional Traffic Simulations
If your API supports global campaigns, testing from a single region isn’t enough. Deploy load generators across multiple cloud regions - like AWS us-east-1, eu-west-1, and ap-southeast-1 - to simulate clients from different parts of the world [17][18]. This setup can uncover issues specific to certain regions, such as routing inefficiencies, TLS handshake delays, or CDN cache misses, which might not appear in single-region tests.
To better reflect real-world traffic, use weighted traffic distribution. For instance, Gatling’s randomSwitch function allows you to route 70% of virtual users to a U.S. endpoint and 30% to a European one [15]. Pair this approach with regional header injection, including custom headers like X-User-Region or Accept-Language, so your API gateway can route and log traffic based on geographic origin [17][18].
Start with a single-region baseline test before adding multi-region complexity [18]. This step-by-step approach helps pinpoint whether latency spikes are caused by your API logic or network issues between regions. Focus on P95 and P99 response times for each region, as these metrics highlight performance gaps that can significantly impact user experience [5][4].
Monitoring and Observability During Scalability Tests
When running scalability tests, real-time monitoring is non-negotiable. Without it, you might know something has gone wrong but lack the insight to pinpoint the source of the problem. This becomes especially critical when simulating traffic to identify failure points. With dynamic loads in play, observability tools help uncover bottlenecks and weak spots in your system.
Here’s the key difference: Monitoring tells you something’s wrong, but observability explains why.
"Monitoring tells you when something is wrong... Observability lets you understand why something is wrong, even for failure modes you didn't anticipate." - REST API Monitoring & Observability Guide [19]
Instrumenting APIs for Metrics, Logs, and Traces
To achieve effective observability, you need to focus on three core elements: metrics, logs, and traces. Metrics provide a snapshot of system performance, logs capture detailed events, and traces shed light on how requests flow through services.
OpenTelemetry (OTel) has become the go-to standard for integrating these signals into a unified framework. By using the OTel SDK, you can:
- Send metrics to Prometheus for analysis.
- Forward structured JSON logs to tools like Loki or Datadog.
- Export distributed traces to platforms such as Jaeger or Grafana Tempo.
Make sure to propagate unique identifiers like request_id or trace_id. These IDs allow you to reconstruct the journey of a slow or problematic request, particularly during high-traffic scenarios.
Pro tip for logs: Avoid plain-text formats. Instead, use structured JSON logs, which are machine-readable and filterable. This enables you to quickly sift through millions of events using attributes like user_id, endpoint, or status_code. During high-concurrency tests, this speed can save hours of troubleshooting.
Building Real-Time Dashboards for Scalability Testing
A well-designed dashboard is your best ally during scalability tests. Focus on the Four Golden Signals - Latency, Traffic (RPS), Errors, and Saturation - for a clear picture of your API’s health under load. A Prometheus + Grafana stack offers excellent coverage for these metrics, while tools like Datadog provide a more streamlined, all-in-one solution (starting at $15 per host per month).
When monitoring latency, always track p50, p95, and p99 percentiles. Averages can hide critical spikes, but p99 latency is especially important for high-stakes transactions like real-time data synchronization.
Here are some tips for setting up your dashboards:
- Use PromQL queries like
rate(http_requests_total[1m])instead of raw counters to avoid misleading data during active tests. - Separate success and error latencies into different panels. Failed requests often return faster than successful ones, and combining them can distort your averages.
- Enable drill-down links in Grafana to jump directly from latency spikes to related traces in Tempo or logs in Loki.
These dashboards provide actionable insights that help refine automated test workflows on the fly.
Defining SLIs and SLOs for Real-Time Monitoring
Before testing begins, define your Service Level Indicators (SLIs) and set Service Level Objectives (SLOs). This avoids subjective judgments later by providing clear criteria for success or failure.
For internal APIs, a good starting point is an SLO of 99.9% availability with a p99 latency target of 200ms to 500ms. Below is a sample of healthy and alert thresholds based on industry benchmarks:
| Signal | Healthy Threshold | Alert Threshold |
|---|---|---|
| p95 Latency | < 500ms | > 1s for 5 min |
| p99 Latency | < 1s | > 2s for 5 min |
| Error Rate | < 2% | > 10% for 5 min |
| Gateway Latency | < 10ms | > 50ms |
| Goroutine Count | < 2,000 | > 5,000 for 10 min |
One often-overlooked metric is queue depth, which signals when request rates exceed processing capacity. Monitoring this alongside latency percentiles can serve as an early warning system, helping you address potential issues before they escalate.
Finally, aim for internal SLOs that are slightly stricter than your external SLA commitments. For instance, if your SLA guarantees 99.9% uptime, set your internal target at 99.95%. This extra buffer provides a safety net, ensuring you meet external expectations even during unexpected challenges.
Integrating Scalability Testing Into Development Workflows
Once your monitoring and observability setup is ready, the next step is to make scalability testing a regular part of your development process. This ensures your team is always prepared, rather than scrambling before a big launch.
Automating Scalability Tests in CI/CD Pipelines
A tiered testing strategy works best for balancing speed and thoroughness. For example:
- Lightweight smoke tests: Run these on every build. A quick test, like 30 Virtual Users (VUs) for 60 seconds, ensures pipelines remain efficient.
- Deeper stress tests: Schedule these nightly or weekly. A single k6 process can handle 5,000–10,000 VUs and generate up to 100,000 requests per second for more extensive testing [21].
To streamline this process, set automated pass/fail thresholds directly in your test scripts. For instance, define a rule like p95 < 300ms, and if this threshold is exceeded, the CI pipeline will automatically fail. Keeping your load test scenarios, dataset snapshots, and tool versions in the same Git repository as your API code ensures consistency and eliminates guesswork during release decisions [8].
"Shipping a product without load testing is a gamble. You do not know your breaking point until users find it for you." - ECOSIRE Research and Development Team [21]
If you're just starting out, it’s a good idea to set CI performance jobs to advisory mode (allow_failure: true). This allows your team to gather baseline data without deployment blockers while fine-tuning thresholds [20].
Once automated tests are in place, the next step is to validate performance in real-world production environments.
Using Canary and Blue-Green Deployments for Validation
Automated tests provide a solid foundation, but deployment strategies like canary and blue-green deployments add another layer of confidence under actual traffic conditions.
- Canary deployments: Gradually roll out a new version by directing a small portion of production traffic to it. Start with 1%, then increase to 5%, 25%, 50%, and eventually 100% [22][23]. For example, if 5% of traffic encounters a version with a 20% failure rate, the overall system error rate stays capped at 1% [26]. Tools like Argo Rollouts and Flagger can compare metrics between the canary and stable versions, triggering automatic rollbacks if issues arise [22][23]. Focus on tail metrics like p95 or p99 latency, as averages often hide problems affecting smaller user groups.
"The most critical QA activity in modern deployments isn't running tests - it's defining the metrics that trigger an automatic rollback. If you can't answer 'at what error rate do we roll back?' before deploying, you're not ready to deploy." - Yuri Kan, Senior QA Lead [25]
- Blue-green deployments: These are ideal for high-stakes updates or database migrations. They allow for an instant switch to the new environment and provide an equally fast rollback option if needed [24][27]. However, they come with a cost: running two identical environments temporarily doubles infrastructure expenses.
Documenting and Governing Scalability Test Results
"A load test is only valuable if the result changes a decision." - Kristian Razum, Author, LoadTester [3]
To make your results actionable, encode performance goals in machine-readable YAML files (e.g., performance.yaml). These files should outline latency targets, error rate limits, and resource budgets. GitLab adopted this approach in May 2026, linking endpoint categories to Prometheus metrics. This allowed AI systems to flag performance issues automatically during CI runs [20], shifting governance from manual reviews to automated checks.
Keep your test scenarios relevant with a weekly refresh cycle. Update traffic snapshots and remove outdated scenarios to reflect current production behavior [28]. Export results to a time-series database like Prometheus or InfluxDB, and use Grafana to monitor trends over time. This proactive approach helps teams anticipate performance issues rather than just reacting to them.
Applying Scalability Testing to Marketing Analytics Integrations
Testing Scalability for Marketing Analytics APIs
Marketing analytics pipelines often face sudden surges in traffic during campaigns, promotions, or live events. Without proper scalability testing, these systems can fail silently, leading to expensive mistakes.
One of the biggest risks is undetected sync failure. According to research, 80% of enterprise syncs between platforms like Salesforce Marketing Cloud (SFMC) and Data Cloud that pass standard audit logs still contain incomplete or misaligned records[29]. Even a 10% sync failure in an active audience can result in $500 to $2,000+ in wasted media spend due to irrelevant sends[29]. A major culprit? Schema mismatches, which account for 30%–40% of reported sync errors[6]. This means testing must go beyond just measuring volume - it also needs to ensure data accuracy.
"API rate limits only tell you if the connection throttled; they don't confirm data integrity, field mapping accuracy, or completeness of the sync payload itself." - MarTech Monitoring[29]
Effective scalability tests should validate record counts, check field-level completeness, confirm schema consistency, and ensure idempotency to avoid duplicate actions during retries in high-traffic scenarios[6][32]. Even systems that handle 10,000 short requests per second can fail without proper connection management under high concurrency loads[2].
Addressing these issues also requires ensuring that data remains timely and meets delivery SLAs.
Validating Data Freshness and Delivery SLAs
In marketing workflows, data freshness is a non-negotiable requirement. Stale data can lead to costly errors, like sending onboarding messages to users who have already converted or delaying high-intent lead routing until interest wanes[30].
Take this example: SFMC Journey Builder evaluates entries every 15 minutes, but if Data Cloud segments refresh only every 6 hours, it creates a 65-minute lag for new entries[33]. For organizations managing databases with millions of contacts, query timeout rates can exceed 40% when running concurrent journeys with nested segment logic[33].
To address this, sync intervals should align with journey evaluation frequencies. For instance, segment refresh rates should be at least twice as fast as journey evaluations. Beyond uptime metrics, track key indicators like lead ingestion success rates, attribution completeness, and routing latency. For high-intent leads, aim for a routing latency target of under 5 minutes[7].
"A 99.9% webhook delivery SLI is not sufficient if 4% of those payloads arrive without source attribution and 2% are duplicated in the CRM." - mytest.cloud[7]
Use synthetic journeys - test identities that mimic the complete path from campaign click to CRM record - to confirm data arrives within the SLO window and includes all necessary fields[7]. Set up alerts for unexpected drops in transaction volumes, as these often indicate silent API failures that return "200 OK" while discarding data in the background[34].
Using Marketing Analytics Tools Directory to Find Scalable Tools
The tools you choose are just as important as the testing strategies you implement. Selecting platforms that offer real-time monitoring and robust testing capabilities is critical for scalable marketing integrations. The Marketing Analytics Tools Directory helps teams navigate the options by categorizing tools based on features that impact scalability, such as real-time analytics, reporting dashboards, and data integration solutions.
When evaluating tools, prioritize platforms that support OAuth2, offer idempotent endpoints for safe retries, and use "zero-storage" architectures to reduce PII exposure[6][31]. Look for platforms that support native or virtual webhooks for event-driven updates and offer incremental filters like updated_gte to avoid costly full-table refreshes during sync cycles[31].
The data integration market is projected to grow to $33.24 billion by 2030, with a 13.6% CAGR[36]. Meanwhile, end-to-end latency in modern real-time stacks has dropped from hours in 2023 to under one second by 2026[35]. The Marketing Analytics Tools Directory helps identify which tools are adapting to these advancements and which are still stuck in outdated batch-processing methods.
Conclusion
Real-time API scalability testing isn’t something you do once and forget - it’s an ongoing effort to safeguard revenue, maintain data accuracy, and uphold user trust. Amazon’s research highlights just how high the stakes are: every 100ms of added latency can reduce sales by 1% [9]. This underscores the direct connection between performance issues and business outcomes.
The strategies outlined work together as a system. Planning establishes goals tied to business needs and creates realistic traffic models. Dynamic simulation brings those models to life with spike, soak, and load testing scenarios. Monitoring key metrics like p95 and p99 latencies uncovers edge-case issues that averages might miss. And by embedding testing into CI/CD pipelines, you ensure performance remains stable as the codebase evolves. Combined, these practices create a reliable framework for sustained, high-quality performance.
"Performance testing isn't just a technical checkbox before a release. For high-traffic marketing campaigns, it's risk management, revenue protection, and brand reputation rolled into one." - Henry Cavill, SRE [37]
When it comes to marketing analytics, the stakes are even higher. It’s not just about testing throughput; it’s about ensuring data freshness and meeting delivery SLAs across intricate, multi-platform pipelines. Mature API testing practices make frequent deployments smoother and reduce the likelihood of production hiccups. True performance comes when testing becomes a routine part of engineering, not just a last-minute checklist.
The Marketing Analytics Tools Directory is a great resource for finding tools that offer real-time analytics, seamless integrations, and the observability needed to support effective scalability testing. These tools complete the cycle of testing, monitoring, and continuous improvement described here.
FAQs
How do I determine realistic peak TPS for API tests?
To figure out your system's baseline traffic, start by dividing your average daily request volume by the total seconds in a day (86,400). This gives you the average requests per second. Next, account for peak traffic by multiplying that number by 2–3x, and consider short-term spikes by adding up to 50% more capacity.
When testing, simulate a workload that mirrors real-world usage. This means reflecting typical read/write ratios and user behavior patterns. For public APIs, rely on open-model testing to maintain consistent arrival rates and ensure your system can handle the load effectively.
What’s the fastest way to find the real bottleneck during a load test?
To spot a bottleneck during a load test quickly, start by enabling detailed performance logging. This lets you monitor every stage of the API request lifecycle. Pay close attention to endpoints with slower response times, and break down the analysis into key components like database queries, middleware, and external calls.
For a deeper dive, use distributed tracing to pinpoint where failures or delays happen across microservices. Compare these findings with your baseline metrics to zero in on the root cause more effectively.
How can I safely load test an API with OAuth tokens and rate limits?
To safely conduct load testing on APIs that use OAuth and have rate limits, it's important to use isolated test environments with dedicated credentials or sandbox setups. This ensures that your testing doesn't disrupt the production environment.
For OAuth, make sure to implement token refresh strategies. Using mutex locks can help manage token refreshes efficiently, preventing unnecessary overload during testing.
When working with rate limits, simulate 429 Too Many Requests responses to test your retry logic. Ensure that the logic incorporates exponential backoff with jitter. This approach helps avoid synchronized retries, reducing the risk of overwhelming the system.