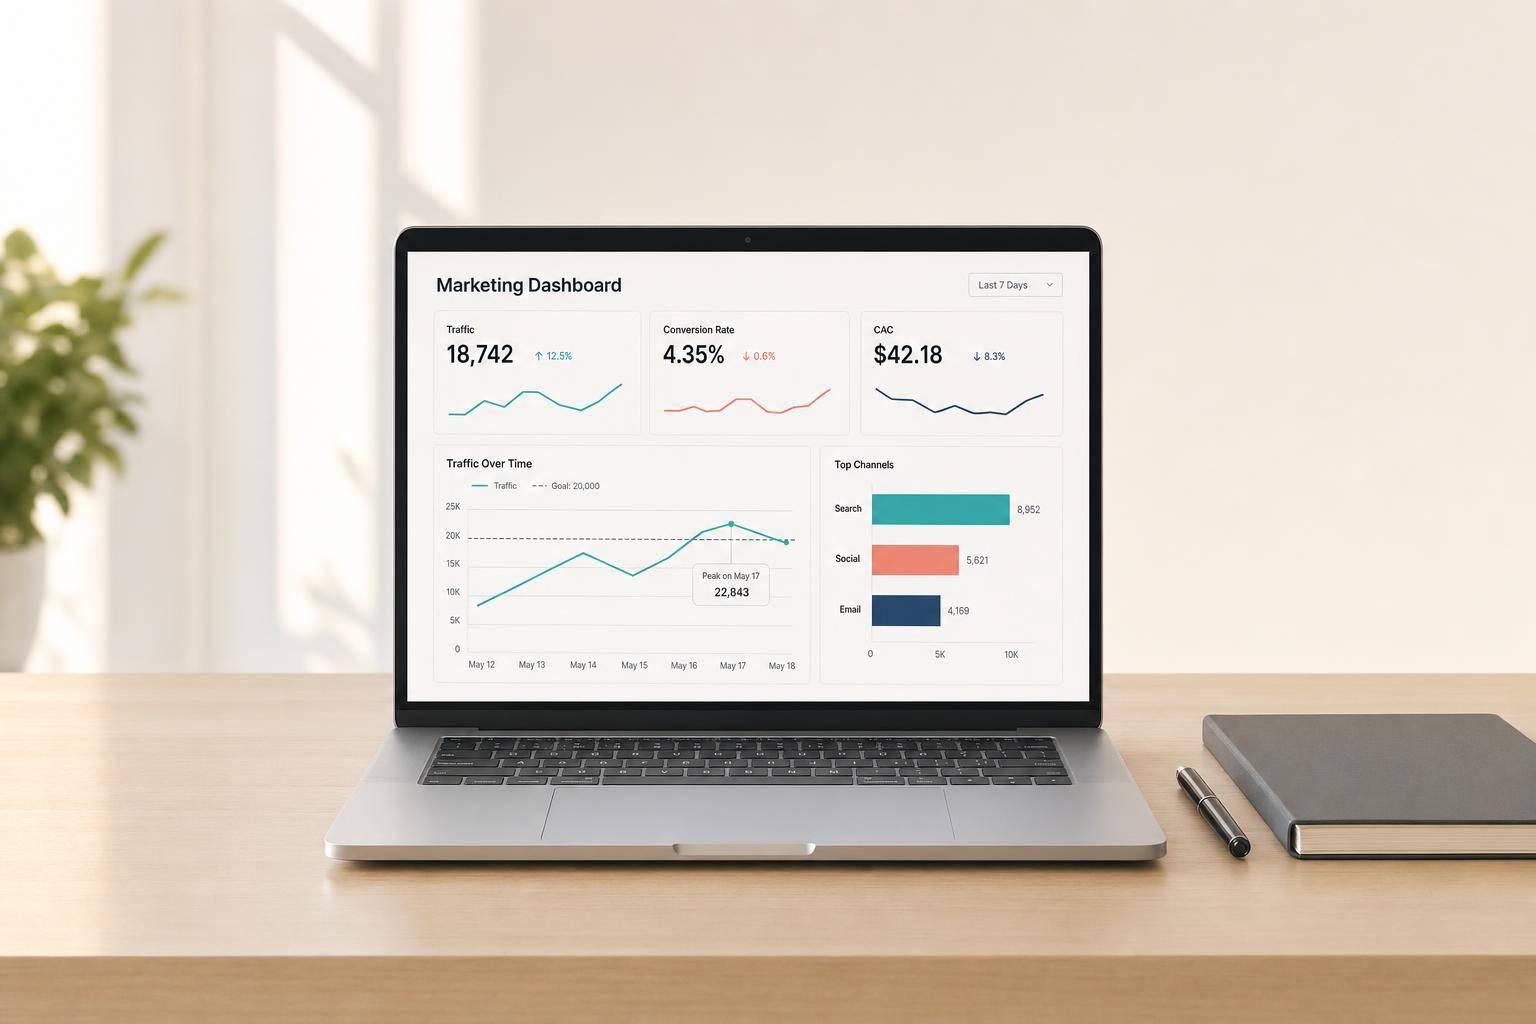
I track 7 metrics together before changing campaign spend, content, or creator mix. My first step is to check links, compare campaign tracking tools, and verify promo codes so reporting errors don’t drive your decisions.
- Reach: Are posts reaching the planned number of accounts?
- Engagement rate: Are people interacting? Keep the rate’s denominator consistent.
- Clicks: Is content sending tracked traffic to your site?
- Conversions: Is that traffic producing confirmed purchases or qualified leads?
- Promo-code use: Are coded orders producing revenue after discounts, cancellations, and refunds?
- Cost per result: Is spend within your limit for the outcome you want?
- Channel-by-channel pace: Is each platform meeting its scheduled targets?
I keep each metric’s current value, target, source, and timestamp in 1 dashboard. I separate pending results from confirmed results and check reporting delays before acting. A starting pace range is 90%–110% of planned results, but I set thresholds around your campaign schedule.
<u>High volume alone is not a reason to scale.</u> I change budget only after checking tracking, result quality, and cost across multiple checkpoints.
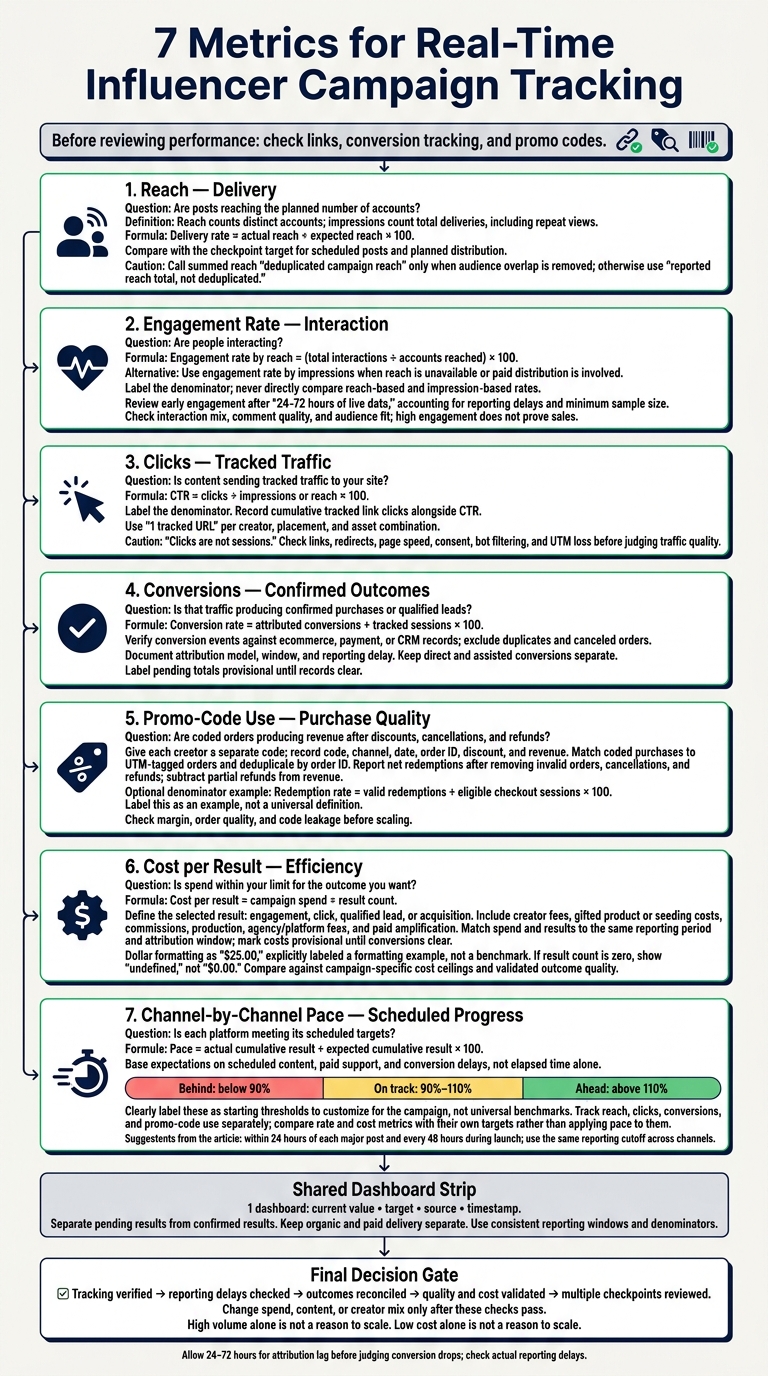
7 Metrics for Real-Time Influencer Campaign Tracking
1. Reach
Check: Accounts Reached
Track distinct accounts reached by each creator and platform using native analytics or a connected dashboard. Record the asset ID, timestamp, reporting window, and latest reach value. Reach counts distinct accounts; impressions count total deliveries, including repeat views.[5][6]
Label summed creator or platform totals deduplicated campaign reach only when your system removes audience overlap. Otherwise, track each separately and label any sum reported reach total, not deduplicated.[7][8]
Use this baseline to check whether delivery is on pace.
Compare: Actual Reach vs. Planned Reach
Compare actual reach with the checkpoint target for scheduled posts and planned distribution. Calculate delivery rate as actual reach ÷ expected reach × 100.
Fill in this checkpoint table with your campaign’s measured figures:
| Creator or channel | Actual reach | Expected reach | Status | Action |
|---|---|---|---|---|
| Creator and platform | Enter measured reach | Enter checkpoint target | Below plan | Verify publication, visibility, and missing reports |
| Creator and platform | Enter measured reach | Enter checkpoint target | On plan | Continue monitoring against scheduled delivery |
| Creator and platform | Enter measured reach | Enter checkpoint target | Above plan | Investigate spikes and duplicate records; flag assets for approved amplification |
When delivery falls below plan, verify publication, visibility, and missing reports before requesting a remedy. When it exceeds plan, separate paid from organic reach where possible and check unexplained spikes or duplicate records. Reach measures delivery, not interaction.[7][8]
Next, check whether reached accounts actually interacted.
sbb-itb-5174ba0
2. Engagement Rate
Check: Engagement Rate and Denominator
☐ Track likes, comments, shares, saves, and any other actions you count as engagements. Define those actions before reporting.[10][12]
Once reach data is available, measure the interactions it produced. Calculate engagement rate by reach: (total interactions ÷ accounts reached) × 100 to see which content is connecting with audiences in real time.[11][13] If reach is unavailable or paid distribution is involved, use engagement rate by impressions instead. Label the denominator on every rate, and never compare reach-based rates directly with impression-based rates.
Separate results by creator, format, and channel. Record raw interaction counts, the denominator, publication time, reporting window, and platform source. Use social media analytics tools to review early engagement after 24–72 hours of live data.[9] Account for normal reporting delays, and wait until you meet your minimum sample size before making changes.
Compare: Engagement vs. Targets
Compare each rate with a campaign target or comparable past content. Use the same formula, interaction set, and elapsed time since publication. Treat the table below as a decision guide: enter measured rates rather than using 1 benchmark for every format.
Creator or format Engagement rate Target or historical rate Response quality Action Creator A - short-form video Measured rate; label denominator Same-format campaign target Strong shares; specific comments Maintain the message and consider approved amplification Creator B - image post Measured rate; label denominator Comparable historical rate Many likes; few saves or comments If engagement is below target, test a clearer benefit or stronger call to action Creator C - carousel Measured rate; label denominator Same-format campaign target High saves; useful product questions Answer questions; consider approved amplification if engagement exceeds target
Read comments for questions, objections, and audience fit, not just volume. Check the interaction mix and comment quality before judging the content. High engagement does not prove sales, so pair the rate with clicks and conversions when possible.
If response stays weak, test 1 messaging change at a time. Before amplifying strong content, verify that engagement comes from genuine audience activity, and check brand safety, audience fit, and usage rights.
Next, check whether engagement turned into clicks.
Influencer Marketing Metrics You Should Be Tracking
3. Clicks
Use clicks to check whether engagement turns into traffic.
Check: Clicks and Click-Through Rate
☐ Count tracked link clicks only. Calculate CTR as clicks ÷ impressions or reach, and always label the denominator. Record cumulative clicks alongside CTR.[16][20]
Assign 1 tracked URL to each creator, placement, and asset combination. Use consistent UTMs and test every link on mobile before publishing.[4][18]
Clicks are not sessions. Compare clicks with analytics sessions. Use website analytics tools to identify discrepancies. Before blaming traffic quality, check redirects, page speed, consent, bot filtering, and UTM loss.[14][15][17]
Compare: Clicks vs. Expectations
Compare cumulative clicks and CTR against the benchmark using the same reporting window.
Creator or asset Clicks Click-through rate Expected results Action Story link Record cumulative clicks Clicks ÷ reach × 100 Compare with the agreed reach-based benchmark Check link visibility. Reel Record cumulative clicks Clicks ÷ impressions × 100 Compare with planned clicks and CTR Verify tracking and the CTA. YouTube description Record cumulative clicks Clicks ÷ impressions × 100 Compare with channel-specific expectations Check traffic quality.
If results fall short, verify the link, CTA, and destination before changing the content.[4][19] Then move to confirmed conversions.
4. Conversions
Check: Confirmed Conversions and Conversion Rate
Verify which tracked sessions turn into confirmed conversions after a click.
☐ Check the conversion event against ecommerce, payment, or CRM records. Make sure it fires once and includes the correct creator or channel identifier. Define which actions qualify, how revenue is counted, and whether repeat actions count. Exclude duplicates and canceled orders.
Conversion rate = attributed conversions ÷ tracked sessions × 100. Label the denominator and session source. Review confirmed totals by creator and channel, not only across the campaign.
Document the attribution model, attribution window, time zone, timestamp, and deduplication rules. Keep direct and assisted conversions separate, and use order or lead IDs to prevent double-counting.
Compare: Conversions vs. Targets
Compare confirmed results with targets for the same reporting window. Specify whether targets are daily, cumulative, or campaign-to-date, and record the expected reporting delay. Keep totals marked provisional until records clear.
| Creator or channel | Confirmed conversions | Conversion rate | Target | Reporting delay | Action |
|---|---|---|---|---|---|
| Creator or channel name | Total reconciled with analytics/CRM records | Attributed conversions ÷ tracked sessions × 100 | Planned conversions or rate | Expected data lag | Continue, investigate, hold, or adjust |
If results fall short, check landing-page load time, message match, mobile usability, and checkout or form completion. Next, review traffic quality and fraud signals. Check those findings against ecommerce, analytics, and CRM records before changing creator budgets.
Then compare promo-code redemptions with orders and revenue.
5. Promo-Code Use
Use promo codes to check purchase quality, not just order volume.
Check: Code Redemptions and Orders
Give each creator a separate promo code. Record the code, channel, date, order ID, discount, and revenue, and store the code on the order in ecommerce or CRM records using marketing analytics tools.[21][22] Check that the code is active and appears in approved content. Its expiration, eligibility, and usage limits must match the brief.
Match coded purchases to UTM-tagged orders and deduplicate by order ID. Apply the attribution rule you set in advance. A code shared across channels doesn't tell you which channel drove the sale.[3][23]
Report net redemptions after removing invalid orders, cancellations, and refunds. Subtract partial refunds from revenue. Where data is available, review average order value, new-customer share, refund rate, and conversion rate.
Define the redemption-rate denominator once - for example, valid redemptions ÷ eligible checkout sessions - and use it consistently.[24]
Compare: Redemptions, Revenue, and Sales Quality
Compare net redemptions and net revenue against campaign-to-date targets. Use the tracker below to spot delivery, attribution, offer-quality, or profitability issues.
Creator code Net redemptions Net revenue Expected redemptions Margin and order-quality flags Action Code below plan Below expected pace Check after discounts and refunds Target for posts delivered so far Healthy clicks, few coded orders Test the code, review instructions, and check checkout friction Code above plan Above expected pace Compare against expected revenue and margin Target for posts delivered so far Low average order value or high cancellations Review margin before scaling Code with leakage Separate suspect orders Flag uncertain attribution Original delivery target Code appears on coupon sites or other outside channels Investigate sharing before assigning credit
When results fall short, test code spelling, expiration, eligibility, minimum spend, stacking rules, and checkout compatibility. Compare timing, reach, clicks, and landing-page behavior with redemptions. Low clicks point to delivery or CTA issues; strong clicks with weak redemptions point to offer or checkout friction. High redemption volume alone doesn't justify a deeper discount.
Check cancellations and contribution margin before scaling the offer. Code use is 1 sales signal, not the full measure of influencer impact.[3][23][25]
Next, compare those results with spend per result.
6. Cost per Result
Check: Spend per Selected Result
☐ Calculate cost per result as campaign spend ÷ result count. This tells you whether live spend is producing the intended outcome. Define the result before using this metric: engagement, click, qualified lead, or acquisition, depending on the campaign objective. Document creator fees, gifted product or seeding costs, commissions, production, agency/platform fees, and paid amplification.[1][28][29]
Match spend and results to the same reporting period and attribution window. Label costs provisional until conversions clear, and record the report date and attribution window.[26][27] Show costs in dollars, such as $25.00. If the result count is zero, report “undefined,” not $0.00.
Compare: Cost vs. Limits and Result Quality
Base cost ceilings on allowable acquisition cost, margin, and customer value - not a generic influencer benchmark. For purchase-focused campaigns, compare only rows that use the same acquisition definition. Use the table to assess cost and outcome quality together.
| Creator or channel | Spend | Result count | Cost per result | Cost ceiling | Outcome quality | Action |
|---|---|---|---|---|---|---|
| Pending purchases | Spend incurred | 0 confirmed purchases | Undefined | Pre-set CPA limit | Results pending | Verify tracking and conversion lag |
| Above ceiling | Spend in the same reporting period | Confirmed purchases | Above ceiling | Pre-set CPA limit | Check customer value and margin | Check tracking, attribution, and margin before reducing spend |
| Below ceiling | Spend in the same reporting period | Confirmed purchases | Below ceiling | Pre-set CPA limit | Validated revenue and healthy margin | Expand support gradually |
Before cutting spend, check tracking, UTMs, promo codes, pixels, server-side events, deduplication, attribution windows, and delayed conversions.[26][1][30]
Review traffic quality with top analytics tools too: bounce rate, invalid leads, duplicate submissions, refunds, and low-intent clicks. Reduce spend only when these checks separate a performance problem from a reporting or timing issue.
Low cost alone is not a reason to scale. Increase amplification in controlled increments. After each change, recheck cost, quality, and volume before committing more budget.
7. Channel-by-Channel Pace
Channel pace shows which platform is falling behind first. Use it after checking each metric separately: pace measures delivery progress, while the earlier checks assess quality and outcomes.
Check: Results vs. Expected Progress
☐ Review each active channel separately for reach, clicks, conversions, promo-code use, spend, and cost per result. Keep organic and paid delivery separate.[31][34][36]
Pace = actual cumulative result ÷ expected cumulative result × 100. Base expected results on scheduled posts, videos, Stories, paid support, and conversion delays - not elapsed campaign time alone. Track reach, clicks, conversions, and promo-code use separately.[32][35]
This view helps distinguish delivery problems from performance problems.
Compare: Channel Pace and Next Steps
Set campaign-specific status thresholds before launch. Start with Ahead: above 110%; on track: 90%–110%; behind: below 90%. Review results at fixed checkpoints, such as within 24 hours of each major post and every 48 hours during launch. Use the same cutoff for every channel.[35]
Choose a pace metric that fits each channel’s role. Compare rate and cost metrics against their own targets; use pace only to assess delivery speed.
Channel Pace metric Actual cumulative results Expected cumulative results Pace percentage Status Action Reach Cumulative accounts reached Reach planned by checkpoint Actual ÷ expected × 100 On track Confirm next scheduled Reel and monitor engagement rate TikTok Clicks Cumulative tracked clicks Clicks planned by checkpoint Actual ÷ expected × 100 Ahead Validate conversion quality before adding paid support YouTube Conversions Confirmed conversions Lag-adjusted conversions planned by checkpoint Actual ÷ expected × 100 Behind Check attribution lag, links, and landing-page conversion rate
Let the slowest channel guide what you review next. Before changing remaining deliverables or paid support, check tracking, unpublished content, insufficient delivery, and conversion delays.
Shift available budget toward leading channels only after multiple checkpoints confirm acceptable efficiency, outcome quality, and room to scale. Keep scheduled creator deliverables in place; high volume alone doesn't justify a budget shift.[31][33]
Conclusion: Check All 7 Metrics Before Making Changes
Check all 7 metrics together before changing the campaign. Use these analytics tools and resources to streamline your tracking.
Final checklist: ☐ Reach ☐ Engagement rate ☐ Clicks ☐ Conversions ☐ Promo-code use ☐ Cost per result ☐ Channel-by-channel pace. Record each metric’s current value, target, source, and timestamp.
Verify links, conversion events, and promo codes before acting. Reconcile platform reports with website analytics, ecommerce, CRM, and order records.
Treat delayed results as preliminary. Allow 24–72 hours for attribution lag before judging conversion drops.[37][38] Log each anomaly’s date, time, channel, asset, metric, expected value, observed value, source, and suspected cause.
Fix confirmed tracking failures immediately. Base performance changes on campaign-specific targets and validated revenue or qualified leads. Exclude duplicates, test orders, cancellations, refunds, and unqualified leads. Record each decision, its evidence, the owner, and the follow-up time.
Change spend, content, or creator mix only after these checks pass.
FAQs
How do I set targets for my first influencer campaign?
Set SMART objectives - specific, measurable, achievable, relevant, and time-bound - that align with your business strategy. Choose your primary goal: brand awareness, lead generation, or sales. Then select KPIs that track progress toward that goal, such as reach for awareness or conversion rates for sales.
Use the Marketing Analytics Tools Directory to find tools for tracking and benchmarking these metrics.
What if engagement is high but sales are low?
High engagement with low sales often means your content gets attention but doesn’t lead to purchases. Check whether your goals favor brand awareness over immediate conversions. Sentiment and reach can account for 40% to 60% of an influencer’s impact.
If sales are the priority, use real-time analytics to spot where people leave the funnel, check for technical issues, or sharpen your call to action. Browse the Marketing Analytics Tools Directory for more detail.
How can I tell whether influencer sales are incremental?
Use incrementality tests with holdout groups to measure the sales lift your influencer campaign caused. Compare an audience exposed to the campaign with a control group that wasn’t exposed [1]. Research suggests that only about 35–40% of attributed digital conversions are typically incremental [1].
For more guidance on campaign performance and attribution, see the Marketing Analytics Tools Directory [1][2].