Marketing analytics metrics are the backbone of understanding and improving your marketing efforts. They help you measure performance, optimize strategies, and connect marketing activities to revenue. Here's what you need to know:
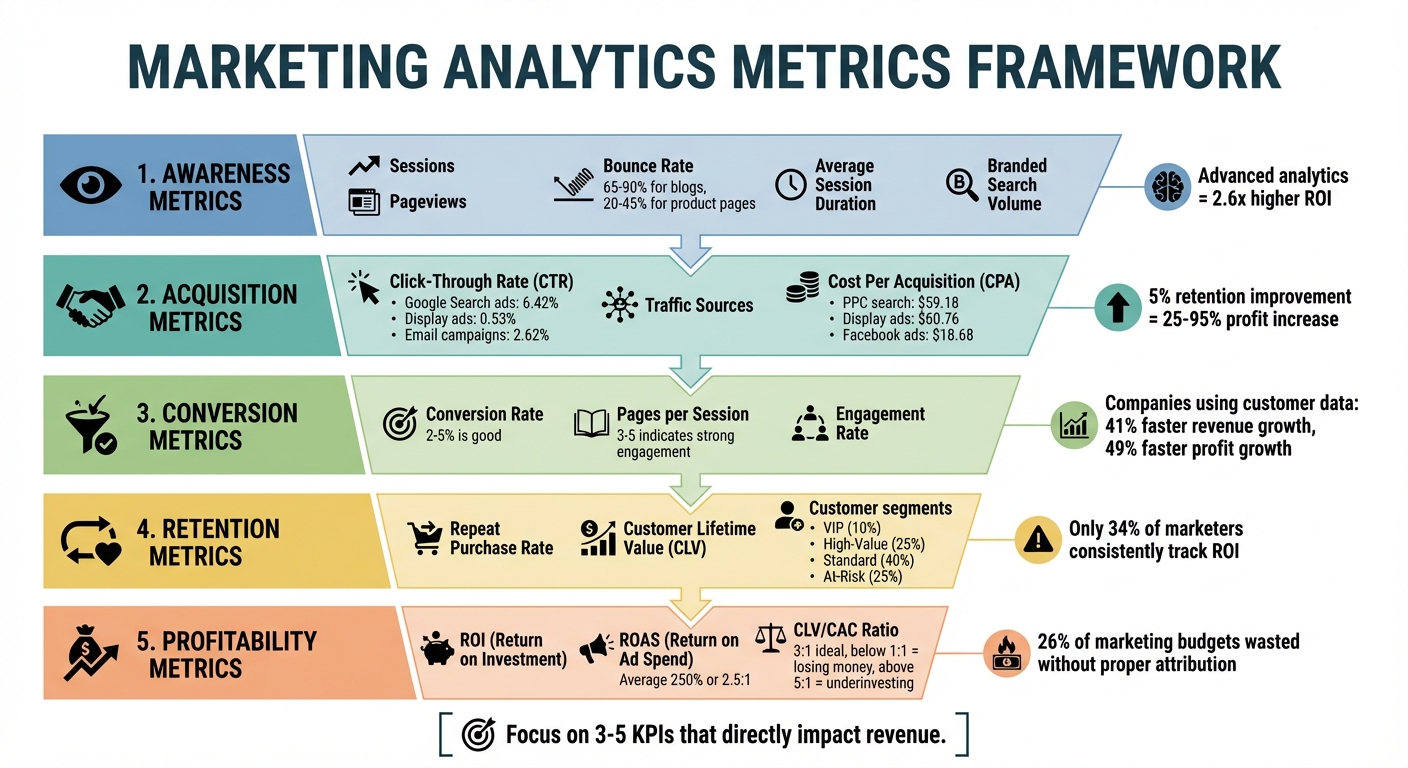
- Key Metrics: Metrics fall into five categories - Awareness, Acquisition, Conversion, Retention, and Profitability. Each category serves a specific purpose, from tracking brand visibility to measuring financial impact.
- Advanced Analytics: Using predictive and prescriptive analytics can lead to 2.6x higher ROI compared to basic tracking methods.
- Important Metrics:
- Traffic Metrics: Sessions, Pageviews, Bounce Rate, and Average Session Duration help evaluate website analytics tools for engagement and user behavior.
- Conversion Metrics: Conversion Rate, Cost Per Acquisition (CPA), and Click-Through Rate (CTR) reveal how effectively visitors take desired actions.
- Financial Metrics: ROI, ROAS, and CLV/CAC ratio assess profitability and long-term customer value.
- Retention Metrics: Customer Lifetime Value (CLV), Repeat Purchase Rate, and Branded Search Volume highlight customer loyalty and retention.
To streamline tracking, focus on 3-5 KPIs that directly impact revenue, and use analytics tools for business and structured dashboards for clarity. Tools like Google Analytics 4 or specialized platforms can centralize data, automate insights, and improve decision-making.
Takeaway: By focusing on the right metrics and connecting them to business outcomes, you can turn marketing into a measurable growth driver.
Marketing Analytics Metrics Framework: 5 Categories from Awareness to Profitability
Marketing Metrics: A Complete Guide to the Most Common Marketing Metrics and Marketing Analytics
sbb-itb-5174ba0
Traffic and Engagement Metrics
Traffic metrics are a key indicator of brand visibility and can help predict trends in leads and revenue. However, it's important to distinguish between the quantity and quality of traffic. A high volume of visitors means little if they aren't engaging with your content.
Sessions and Pageviews
Pageviews (referred to as "Views" in GA4) count every instance a page loads or reloads in a browser. This metric reflects the total exposure your content receives. On the other hand, Sessions group a user's interactions within a set timeframe, typically ending after 30 minutes of inactivity or at midnight. A single visitor can generate multiple sessions.
Both metrics serve distinct purposes. Pageviews highlight which pages attract the most attention, which is especially valuable for ad-supported websites where higher views can directly impact revenue. Sessions, meanwhile, provide insight into the quality of traffic and how much time users spend on your site. In fact, about 59% of marketers focus on tracking sessions over unique users because sessions, combined with conversions, offer a clearer picture of campaign performance.
"Sessions is a good metric to understand how attractive your site is and how well you're doing as a marketer to attract users to your site."
- Chris Wilks, BrandExtract
Metrics like Pages per Session - calculated by dividing Pageviews by Sessions - offer a deeper look at user behavior. For instance, three to five pages per session typically indicate strong engagement, while one to two pages might signal a high bounce rate or less relevant content. For context, B2B companies average 1.89 pages per session, while B2C companies average 2.05. GA4 also introduces "Engaged Sessions", which track sessions lasting over 10 seconds, triggering a conversion event, or involving at least two pageviews.
A higher pageview-to-user ratio generally reflects stronger visitor interest. You can also filter sessions by "Source/Medium" to identify which marketing channels drive repeat visits and deeper engagement. Keep in mind that even a one-second delay in page load time can reduce conversions by 7%, highlighting the importance of technical performance.
This understanding of traffic metrics provides the groundwork for exploring visitor disengagement, which is covered in the Bounce Rate section.
Bounce Rate
Bounce rate measures the percentage of single-page sessions where users leave without further interaction. It helps assess whether a page effectively captures interest or if there’s a mismatch between user intent and content. However, in some cases, a high bounce rate may simply mean users found the information they needed quickly.
"Bounce rate is one of the most misunderstood metrics in analytics. Teams panic when it is high, celebrate when it is low, and rarely ask whether the number actually means what they think it means."
- KISSmetrics Editorial
Benchmarks vary depending on the page type. Blog posts often see bounce rates between 65% and 90%, product pages range from 20% to 45%, and checkout pages should stay below 20%. Higher rates on checkout pages may point to trust issues or friction in the process. Additionally, slower page load times - like increasing from 1 to 5 seconds - can cause bounce rates to spike by up to 90%.
To reduce bounce rates where extended engagement is desired, focus on these strategies:
- Ensure pages load in under 3 seconds.
- Align traffic sources with landing page content.
- Use clear and compelling calls-to-action.
GA4 now prioritizes "Engagement Rate", offering a more detailed look at user interest compared to traditional bounce rate tracking.
Average Session Duration
Average session duration measures the time between the first and last recorded events in a session. Longer durations generally indicate that users find your content engaging and relevant, while shorter durations may hint at usability issues or less compelling content. This metric can validate your content strategy by revealing which topics resonate most with your audience.
You can use this metric to identify friction points in your conversion funnel. For example, segment sessions lasting over 60 seconds without a conversion to uncover potential UX issues. Improving readability with bullet points, subheaders, and shorter paragraphs, as well as incorporating visuals like images, infographics, and videos, can also help boost engagement.
For websites with long-form content or complex forms, consider adjusting GA4’s default session timeout settings (30 minutes) to better reflect actual user behavior. Keep in mind that 88% of online consumers are less likely to return after a single bad experience, making session duration a critical measure of site health. These metrics offer actionable insights that can guide your marketing strategies effectively. To track these KPIs accurately, choosing the right marketing analytics tools is essential for data-driven decision-making.
Conversion and Acquisition Metrics
Conversion and acquisition metrics help you understand whether visitors are taking the actions you want and how smoothly they move through your funnel. These insights lay the groundwork for discussing financial and ROI metrics in the next section.
Conversion Rate
Conversion Rate (CR or CVR) measures the percentage of visitors who complete a desired action, such as making a purchase, signing up, or downloading a resource. To calculate it, divide the number of conversions by the total number of visitors, then multiply by 100. For example, if 100 people visit your site and 3 make a purchase, your conversion rate is 3%.
Generally, a conversion rate between 2% and 5% is considered good, while a rate below 1% might signal problems with your website design, calls-to-action, or audience targeting. Breaking down conversion rates by traffic source, device type, or demographic can help pinpoint which parts of your strategy are working best.
"After defining the goals and objectives with our client, we identify the key metrics for the campaign. We typically look at CTR, conversion rate, cost per conversion, and ROAS after a match-back process."
- Steph Busia, AgencyAnalytics
For example, if your email campaigns show a 4% conversion rate but social media ads only achieve 1.5%, reallocating resources to email could improve your results. However, it’s essential to pair conversion rate data with other metrics like Cost Per Acquisition (CPA) and Customer Lifetime Value (CLV) to get a complete picture of your campaign’s financial impact.
Now, let’s focus on how CPA measures budget efficiency.
Cost Per Acquisition (CPA)
Cost Per Acquisition (CPA) shows how much you’re spending to gain each new customer through a specific channel or campaign. To find your CPA, divide your total ad spend by the number of acquisitions. For example, if you spend $5,000 and acquire 100 customers, your CPA is $50.
CPA benchmarks depend on the channel. On average, PPC search ads cost around $59.18 per acquisition, while display ads are slightly higher at $60.76. Facebook ads tend to be more budget-friendly, averaging $18.68 per acquisition. In contrast, B2B SaaS campaigns often see CPAs between $100 and $300 due to longer sales cycles and higher customer values. A solid rule of thumb is to maintain a Customer Lifetime Value to CPA ratio of at least 3:1. If your CPA is high, it might indicate issues like poor targeting or friction in the conversion process. Comparing CPAs across platforms can help you allocate your budget to the most efficient channels.
"Improving QS [Quality Score] can help reduce click costs, which in turn help lower CPA."
- Ian Dawson, Lead Strategist, HawkSEM
To reduce CPA, focus on strategies like improving ad relevance and enhancing your landing page experience to boost your Google Ads Quality Score. Retargeting campaigns can re-engage users who’ve shown interest, while using negative keywords can filter out irrelevant traffic. Even small tweaks, such as improving page load times or optimizing for mobile, can make a big difference in conversion rates.
Click-Through Rate (CTR)
Click-Through Rate (CTR) tracks the percentage of people who click on your ad or link compared to the total impressions it receives. To calculate CTR, divide the number of clicks by the number of impressions, then multiply by 100. For instance, a CTR of 3% means three out of every 100 viewers clicked on your ad.
CTR acts as an early indicator of how well your message resonates with your audience. In paid advertising, a higher CTR can boost your ad’s Quality Score, which may lower your Cost Per Click and improve ad positioning. In organic search, the top Google result typically garners a CTR of about 39.8%, with the second and third positions dropping to 18.7% and 10.2%, respectively.
Benchmarks vary by channel: Google Search ads average 6.42%, display ads hover around 0.53%, and email campaigns typically see about 2.62%. Branded links can boost CTR by up to 39%, while personalized calls-to-action have been shown to convert 202% better than generic ones. Adding schema markup to earn rich snippets can also increase organic CTR by 20–30%.
"Click-Through Rate isn't just a number. It's a direct window into whether your message resonates with real humans making real decisions."
- Hadis Mohtasham, Marketing Manager
However, a high CTR doesn’t guarantee conversions. It could indicate a mismatch between your ad and landing page. To improve CTR, experiment with engaging headlines, clear calls-to-action (like "Get your free quote"), and schema markup for rich snippets. Regular A/B testing can also help identify what resonates most with your audience. Using experimentation platforms allows you to run these tests in real time.
Financial and ROI Metrics
Tracking financial metrics is essential for understanding whether marketing efforts are driving profitability. These metrics connect campaign performance to overall financial health, helping businesses make smarter adjustments.
Return on Investment (ROI)
ROI is the go-to metric for measuring marketing profitability after accounting for all costs. Here's how you calculate it: subtract total marketing costs from net profit, divide that by total marketing costs, and multiply by 100. For example, if you spend $10,000 on a campaign and generate $15,000 in net profit, your ROI would be 50%.
Unlike ROAS, which focuses solely on ad spend, ROI takes a broader view. It includes indirect costs like vendor fees, production, shipping, and returns, giving a more complete picture of profitability.
"ROI measures how your advertising contributes to your business's bottom line, while ROAS only looks at whether a particular ad campaign is generating revenue."
- Russ Shumaker, Hearst Bay Area
Companies that leverage customer data effectively report 41% faster revenue growth and 49% faster profit growth. Yet, despite its importance, only 34% of marketers consistently track ROI. Using free marketing analytics tools can help bridge this gap without increasing overhead. To get accurate results, make sure your attribution model - whether first-touch, last-touch, or multi-touch - correctly ties revenue to the marketing efforts being evaluated.
Return on Ad Spend (ROAS)
ROAS zeroes in on how efficiently specific advertising campaigns generate revenue. The formula is simple: divide revenue by ad spend. For instance, if you spend $1,000 on ads and generate $4,000 in revenue, your ROAS is 4:1 (or 4x).
According to a 2016 Nielsen report, the average ROAS is around 250%, meaning $2.50 is earned for every $1 spent. However, benchmarks vary by industry. For example, baby products have seen returns as high as 371%, while food products average 267%. A ROAS of 4:1 or higher is often considered strong for e-commerce and retail, though industries like SaaS or luxury goods may find a 2:1 ratio profitable due to higher margins.
"ROAS tells you how much money your ads bring in. ROI tells you how much profit you actually keep."
- roas-calculator.org
Even a 5x ROAS can lead to losses if operating costs are high. Use ROAS for daily decision-making, such as comparing ad creatives, keywords, or channels. Many teams rely on real-time marketing analytics tools to monitor these fluctuations as they happen. It's also crucial to calculate your break-even ROAS - the point at which your ad spend covers all costs, not just the ads themselves.
| Aspect | ROAS | ROI |
|---|---|---|
| Primary Focus | Revenue efficiency (top-line) | Profitability (bottom-line) |
| Formula | Revenue ÷ Ad Spend | (Net Profit ÷ Total Investment) × 100% |
| Costs Included | Ad spend only | All costs (COGS, overhead, etc.) |
| Output Format | Ratio (e.g., 4:1) or multiple (4x) | Percentage (e.g., 300%) |
| Best For | Daily campaign optimization | Strategic budgeting and reporting |
Customer Lifetime Value to Customer Acquisition Cost Ratio (CLV/CAC)
The CLV/CAC ratio compares the total revenue a customer generates over their lifetime to the cost of acquiring them. This metric is a strong indicator of long-term business health. To calculate it, divide Customer Lifetime Value by Customer Acquisition Cost. A 3:1 ratio is considered ideal - a ratio below 1:1 means you're losing money on customers, while a ratio above 5:1 might suggest you're not investing enough in growth.
This ratio also highlights the most efficient marketing channels. Channels that bring in high-lifetime-value customers should get priority when allocating budgets. Focusing on lifetime value rather than just first-purchase revenue ensures you don't undervalue campaigns that attract loyal, high-retention customers.
Boosting customer retention by just 5% can lead to profit increases of 25% to 95%. To stay on top of this metric, monitor it monthly or quarterly. Segmenting CLV/CAC by channel (e.g., organic search vs. paid ads) can help pinpoint where your most valuable long-term customers are coming from. If your ratio is low, consider improving customer retention through better service and personalization before ramping up acquisition efforts.
Retention and Customer Loyalty Metrics
Keeping customers around for the long haul is just as important as getting them in the door. Why? Because retaining customers is far less expensive than acquiring new ones - five times less, to be exact. Plus, your chances of selling to an existing customer are over 60%, compared to just 5–20% for a new prospect. These metrics shed light on which customers stick with you, how often they come back, and whether they’re truly loyal to your brand.
Customer Lifetime Value (CLV)
Customer Lifetime Value (CLV) measures the total profit a customer is expected to bring in over the course of their relationship with your business. The formula is straightforward: multiply the average order value by how often they buy and how long they stay loyal. For instance, if someone spends $100 per order, buys four times a year, and sticks around for three years, their CLV is $1,200.
This metric helps you zero in on your most profitable customers and figure out how much you can reasonably spend to acquire more like them. Companies that use predictive CLV analytics have seen retention rates jump by 25–30%.
"CLV provides a different framework for running a business - focusing on what customers truly contribute over their lifetime."
- Peter Fader
To make the most of CLV, segment your customers into tiers: VIPs (top 10%), High-Value (next 25%), Standard (40%), and At-Risk (bottom 25%). This approach lets you allocate your marketing budget where it matters most. For example, in the beauty industry, customers spend 45% more per order after three years with a brand than they did initially. Tools like RFM (Recency, Frequency, Monetary) analysis can help you spot customers whose activity is tapering off, so you can send win-back campaigns before they disappear. It’s all about understanding where your most loyal customers come from and keeping them engaged.
Repeat Purchase Rate
Repeat Purchase Rate is another key metric for gauging customer loyalty. It shows the percentage of customers who make more than one purchase. The calculation is simple: divide the number of repeat buyers by the total number of customers, then multiply by 100. So, if 200 out of 1,000 customers return for a second purchase, your repeat purchase rate is 20%.
This metric reveals how well your retention strategies are working. A high repeat purchase rate suggests customers are finding consistent value in your brand. For example, in 2025, KFC India launched a campaign that blended personalized notifications and SMS with a gamified "Bucket It" experience. The results? A 27% increase in repeat orders, a 22% rise in daily store orders, and a threefold spike in game sessions.
You can also track repeat purchase rates by acquisition channel to see which methods bring in the most loyal customers. Organic search and referrals often outperform discount-driven strategies when it comes to repeat buyers.
Branded Search Volume
Branded search volume is a great way to measure customer loyalty and brand recognition. It tracks how often people search specifically for your brand name, rather than generic product keywords. A high volume of branded searches indicates customers are actively seeking out your brand instead of considering competitors.
Watching branded search trends over time can tell you whether your marketing efforts are driving awareness and loyalty. For instance, a spike in branded searches after a campaign suggests it’s working, while steady growth signals deeper customer affinity. When you combine this data with repeat purchase rates, you get a clearer picture of how your brand awareness translates into long-term retention.
How to Prioritize and Track Metrics
Focus on metrics that directly influence revenue. Metrics like Customer Acquisition Cost (CAC), Customer Lifetime Value (CLV), and Return on Ad Spend (ROAS) are particularly actionable because they guide decision-making and strategy adjustments.
To manage your data effectively, use a three-layer dashboard system.
- Executive Layer: This layer highlights 5–7 key metrics such as Revenue, CAC, CLV, and ROAS. It answers the big question: Is marketing generating profit?
- Operational Layer: Tracks weekly performance indicators like channel performance, conversion rates, and pipeline velocity to identify areas for immediate improvement.
- Diagnostic Layer: Focuses on granular data like click-through rates, page load speed, and email open rates to troubleshoot specific problems.
This structure ensures that metrics are prioritized and attribution is well-organized, making tracking more efficient.
Center your strategy around a North Star KPI to keep everyone on the same page. A common choice is the CLV/CAC ratio, which compares the long-term value of a customer to the cost of acquiring them. A ratio of 3:1 is considered healthy, while 5:1 might indicate underinvestment in growth. If CAC increases faster than CLV, consider adjusting pricing, upselling, or retention strategies. Without reliable attribution, companies waste about 26% of their marketing budgets on poorly performing channels.
Attribution models help identify which touchpoints contribute to conversions. For simple sales cycles, a last-click model might suffice, but it often overemphasizes bottom-of-funnel channels like branded search while ignoring efforts aimed at building awareness. For complex B2B sales, models like U-shaped (40% credit to the first and last touches, 20% to the middle) or W-shaped provide a more balanced perspective. Data-driven attribution, which uses machine learning to assign credit based on actual impact, works best if you have 300–600 conversions per month. Many companies combine multi-touch attribution, marketing mix modeling, and incrementality testing for a complete picture.
Before diving into analysis, ensure your data is clean and consistent. Double-check GA4 conversion events, UTM parameters, and server-side APIs. Standardize campaign naming conventions to avoid data silos, and align your attribution window with your sales cycle. For example, if you sell enterprise software with a 6–12 month buying cycle, a 30-day attribution window will undervalue top-of-funnel efforts.
Operational dashboards should be reviewed weekly for quick adjustments, while executive dashboards are better suited for monthly or quarterly strategic evaluations. By focusing on the right metrics and maintaining a structured tracking approach, marketers can ensure their daily actions align with long-term objectives. For tools to help you implement these frameworks, check out the Marketing Analytics Tools Directory (https://topanalyticstools.com).
Using Marketing Analytics Tools for Better Insights
Modern marketing analytics platforms bring together data from social media, paid ads, CRM systems, and website traffic into a single, actionable dashboard. By consolidating this information, these tools eliminate much of the manual work analysts typically face, freeing up time to focus on strategy and fine-tuning campaigns instead of data preparation. This unified approach also enables real-time insights, which are crucial for staying competitive in today’s fast-paced marketing landscape.
Real-time tracking is a game-changer. Tools like Google Analytics 4 and Adobe Analytics provide automated alerts for unexpected campaign changes, allowing marketers to adjust strategies immediately rather than waiting weeks to identify issues. One standout example: in 2025, ASUS reported saving 90 hours per week by centralizing their marketing data through automated pipelines. These efficiencies not only save time but also make it easier to compare solutions and refine strategies.
For those navigating the crowded analytics tool market, the Marketing Analytics Tools Directory is a valuable resource. It categorizes tools based on features like real-time reporting, A/B testing, dashboards, and business intelligence, making it easier to find the right solution. Whether you’re interested in privacy-focused tools like Plausible (starting at EUR 6/month for 10,000 pageviews) or enterprise-level platforms like GA4 360 ($50,000/year), this directory simplifies the decision-making process.
"Digital marketing analytics is a growth engine. When done right, it empowers your team to move from reactive reporting to proactive strategy."
- Linda Grönlund, Performance and Growth Marketing Manager, Supermetrics
To get the most out of these tools, look for features like native integrations, multi-touch attribution, and qualitative insights such as heatmaps and session replays. These capabilities help clarify user behavior and refine your campaigns. Additionally, AI-driven metrics - like churn probability and revenue forecasting - offer a proactive edge by predicting outcomes and identifying opportunities. With global spending on marketing analytics expected to hit $7.4 billion by 2025, choosing the right platform isn’t just helpful - it’s essential for staying ahead.
Conclusion
Tracking the right marketing analytics metrics can be the difference between guessing and achieving measurable growth. While many teams monitor a variety of metrics, only a small portion truly connect those metrics to revenue. The real challenge isn’t gathering data - it’s zeroing in on the metrics that matter most and using them to make decisions that propel the business forward.
When these key metrics are prioritized, they transform strategies into measurable growth. High-quality analytics can lead to a much higher ROI. For instance, improving customer retention by just 5% can boost profits by anywhere from 25% to 95%. These kinds of results shift marketing from being seen as a cost to being recognized as a driver of strategic growth.
"Analytics converts hindsight into foresight, letting you bet on growth with the confidence of a chief finance officer (CFO)."
- Linda Grönlund, Performance and Growth Marketing Manager, Supermetrics
Modern analytics tools make this transformation even more achievable. Instead of struggling with spreadsheets or juggling fragmented dashboards, today’s platforms centralize data and deliver actionable insights automatically. The Marketing Analytics Tools Directory can help you find the right tools for your needs, whether it’s real-time reporting, A/B testing, business intelligence, or enterprise dashboards. With options ranging from free tools to platforms under $200/month, there’s something available for every budget and business size. This integrated approach ensures every part of your strategy ties back to measurable outcomes.
Focus on identifying three to five key performance indicators (KPIs) that directly align with your business goals. Track these consistently, audit your data regularly, and allow the insights to guide your strategy. Organizations with structured reporting processes make decisions 38% faster than those relying on ad-hoc analysis. Over time, this speed becomes a major advantage, turning data into a powerful competitive edge.
FAQs
Which 3–5 KPIs should I track first?
To dive into marketing analytics, begin by focusing on key metrics like conversion rate (how effectively prospects turn into customers), customer acquisition cost (CAC) (the expense of acquiring a new customer), and return on investment (ROI) (how profitable your campaigns are). Additionally, keep an eye on traffic sources to pinpoint which channels drive the best results and customer lifetime value (CLV) to understand the long-term worth of your customers. These metrics are essential for assessing performance and refining your strategies.
How do I choose the right attribution model?
To select the best attribution model, think about how long and intricate your sales cycle is and what your customer's journey looks like. Single-touch models are a solid choice for straightforward, shorter cycles. On the other hand, multi-touch models give a clearer picture when dealing with longer or more complex customer journeys. Make sure to test your chosen model, listen to customer feedback, and prioritize seamless integrations. This way, attribution becomes a strategic advantage rather than just another reporting tool.
What’s a good CLV/CAC ratio for my business?
A CLV/CAC ratio of 3:1 or higher is generally considered ideal. In simple terms, this means that for every $1 your business spends to acquire a customer, you generate at least $3 in customer lifetime value. This ratio is widely seen as a strong indicator of profitability and long-term sustainability.