Struggling with slow data access and manual reporting? No-code analytics automation is changing the game by letting teams analyze data without writing code. These tools use drag-and-drop interfaces, pre-built connectors, and natural language prompts to simplify the process, saving time and cutting costs. Businesses can now empower more employees - beyond just analysts - to access and use data effectively.
Key Takeaways:
- What it is: No-code analytics automation eliminates coding for data tasks, from ingestion to reporting.
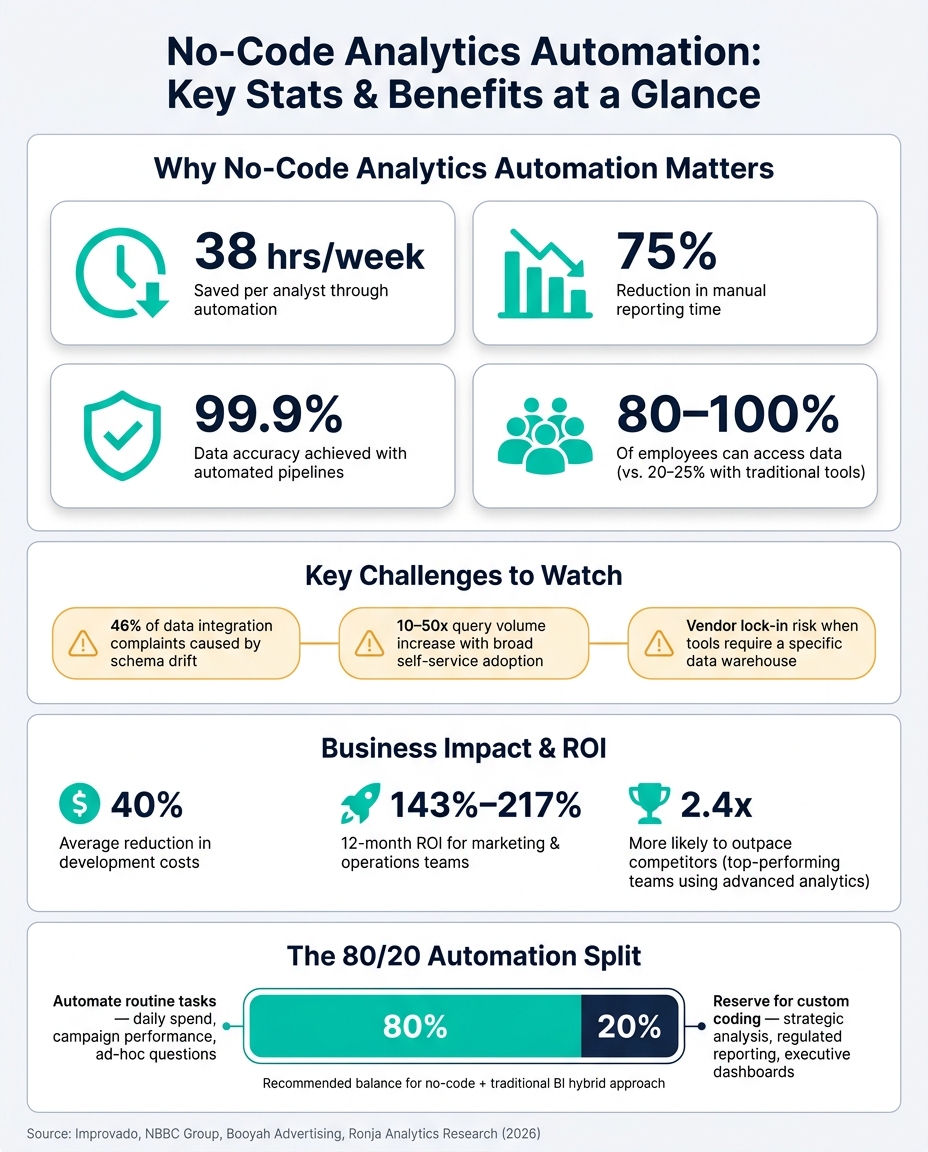
- Why it matters: Saves up to 38 hours per week for analysts, reduces manual reporting by 75%, and costs far less than hiring additional data staff.
- Core benefits: Faster insights, improved accuracy (up to 99.9%), and broader access (reaching 80–100% of employees vs. 20–25% with traditional tools).
- Challenges: Watch for vendor lock-in, schema drift, and rising costs from increased query volumes.
- How to start: Define key metrics, choose top analytics tools for business based on integration and governance, and automate high-priority reports first.
No-code tools are transforming data workflows, enabling smarter decisions without waiting on IT. Let’s explore how to implement and scale these solutions effectively.
No-Code Analytics Automation: Key Stats & Benefits at a Glance
Core Components and Benefits of No-Code Analytics Automation
Key Parts of a No-Code Analytics Stack
A no-code analytics stack is built on distinct layers, each designed for a specific data function. Most modern setups follow a four-layer architecture [7]:
- Collection: Tools like Google Tag Manager and Segment gather raw data from website analytics, apps, and ad platforms.
- Storage: Centralized cloud warehouses such as BigQuery or Snowflake store this data, making it easily queryable.
- Transformation: This layer standardizes and cleans data, handling tasks like UTM parsing, currency conversions, and ensuring consistent metric definitions.
- Activation: Platforms such as Amplitude or Looker, along with automated notifications through Slack or email, deliver actionable insights to stakeholders.
Orchestration ensures these layers work in sequence, creating a smooth pipeline that delivers accurate and complete insights.
Raw data from various platforms often doesn’t align. A governance layer steps in to enforce consistent definitions, allowing teams to collaborate effectively using a single source of truth [1][4]. This seamless integration of components not only simplifies data management but also drives impactful marketing results.
How No-Code Automation Helps Marketing Teams
Automated pipelines take over repetitive data tasks, freeing analysts to focus on generating insights. Without automation, marketing analysts typically spend 60–70% of their time on routine data handling instead of actual analysis [5].
Automation also reduces errors. Manual entry can introduce a 3–5% error rate, but automated processes, combined with standardized metric definitions, ensure everyone works with the same accurate data. For example, in 2026, Booyah Advertising implemented automated pipelines through Improvado, achieving 99.9% data accuracy and speeding up budget pacing updates by 50% compared to their previous manual approach.
"We now trust the data. If anything is wrong, it's how someone on the team is viewing it, not the data itself." - Tyler Corcoran, Booyah Advertising [5]
Real-time dashboards offer another advantage, enabling marketing teams to adjust campaigns within hours instead of waiting for weekly reports. Adding new data sources is also straightforward - teams can configure pre-built connectors instead of writing custom code. This flexibility allows them to manage 50+ campaigns across 15+ platforms without increasing headcount [8][5].
Limitations and When to Use Hybrid Approaches
Despite its benefits, no-code analytics isn’t without challenges.
Vendor lock-in can be a concern. Many platforms require a specific data warehouse, making it costly and disruptive to switch tools [1]. Another issue is schema drift - when platforms like LinkedIn or Facebook change field names or social media analytics structures or data structures, it can silently disrupt pipelines. In fact, schema drift is responsible for about 46% of data integration complaints [5].
Broad adoption can also lead to a surge in query volume. Self-service access often results in 10–50x more queries, which can significantly increase compute costs in consumption-based warehouses [1]. Without proper controls, democratization can quickly become expensive.
"No-code analytics handles routine ad-hoc questions that currently consume 60–70% of a data team's time. The data team remains essential for complex analysis, data modeling, pipeline maintenance, and strategic work." - Anton Melander, April 2026 [1]
For many organizations, a hybrid approach strikes the right balance. No-code tools are ideal for high-volume, routine tasks that would otherwise bog down data teams, while traditional BI tools or custom SQL handle more complex needs like regulated reporting, advanced modeling, and executive dashboards [4]. A practical guideline is the 80/20 split - automate 80% of routine questions (e.g., daily spend, campaign performance) and reserve custom coding for the remaining 20% of strategic, in-depth analysis [4][9].
Recognizing these limitations is essential when choosing the right no-code analytics tools for your organization.
sbb-itb-5174ba0
How to Evaluate and Select No-Code Analytics Tools
Categories of No-Code Analytics Tools
No-code analytics tools are designed for specific purposes, and understanding their categories can help you pick the right one for your needs.
| Tool Category | Examples | Best For |
|---|---|---|
| Pipeline Builders | Fivetran | Moving raw data into a warehouse for technical teams |
| Reporting Layers | Supermetrics, Whatagraph | Consolidating marketing data into spreadsheets or client reports |
| Workflow Automation | Zapier, Make | Trigger-based actions, like Slack alerts for new leads |
| Attribution Platforms | Ruler Analytics | Linking CRM revenue back to original marketing touchpoints |
| Data Transformation | Funnel.io | Cleaning and organizing data before it reaches a BI tool |
The capabilities of these tools vary widely. For example, Level 1 tools, such as Metabase or Looker Studio, provide basic visual query-building but can feel limiting. Level 3 tools allow natural language queries - imagine a sales director asking, "What's our win rate this quarter?" and getting an instant answer. Level 4 tools, often referred to as agentic analytics, take it a step further by automatically monitoring data and flagging anomalies without user input [1].
The key is to identify where your team currently stands in terms of analytics maturity. This helps avoid overpaying for advanced features you don’t need or underinvesting in tools that might limit your growth.
What to Look for When Choosing a Tool
Once you’ve identified which category of tool fits your needs, it’s time to evaluate them based on specific criteria:
Integration depth should be your first checkpoint. A tool is only as good as its ability to connect with your existing systems. Look for pre-built connectors to your CRM, ad platforms, ERP, and billing systems. If a tool lacks these, you may face extra engineering work [1].
Metric governance is another critical factor. A strong semantic layer ensures that key business metrics are defined and enforced consistently across teams. Without it, you risk having different teams arrive at conflicting numbers, eroding trust in your data [1][10].
"No code analytics removes the technical path. The sales director asks the question. The platform connects to the CRM, applies the governed definition of 'win rate,' and returns the answer." - Anton Melander, April 30, 2026 [1]
Pricing can get tricky, especially with consumption-based warehouse models. These can become costly as query volume grows - sometimes increasing by 10–50x with successful adoption [1]. Fixed or seat-based pricing is often a safer bet for teams planning to roll out the tool broadly. Don’t forget to consider the total cost of ownership (TCO), which includes not just licensing fees, but also onboarding, training, and ongoing maintenance costs [11].
Be on the lookout for warning signs during your evaluation. Issues like slow query performance under heavy use, unclear pricing terms, or a lack of role-based access controls can indicate future headaches [11].
| Evaluation Area | Red Flags to Watch For |
|---|---|
| Integration | Manual CSV workflows, limited native connectors |
| Scalability | Slow queries under load, steep overage pricing |
| Pricing | Unclear overage terms, hidden service fees |
| Governance | No retention controls, weak role-based permissions |
| Workflow | Requires engineering for every report change |
| AI Features | Black-box outputs with no explainability |
"The best analytics tool is not the one with the most features. It is the one your team will actually trust, maintain, and use every week." - Jordan Ellis, Senior SEO Content Strategist [11]
Using the Marketing Analytics Tools Directory to Find Tools
Starting from scratch to shortlist analytics tools can be a huge time drain. The Marketing Analytics Tools Directory makes this process easier by organizing hundreds of tools and services into clear categories. It covers everything from real-time analytics and campaign tracking to A/B testing, business intelligence, and reporting dashboards.
Instead of relying on broad web searches, you can filter tools by use case or capability, making it easier to find options that align with your existing tech stack and goals. This approach also lets you apply the evaluation criteria discussed earlier - like comparing pipeline builders with full reporting layers - without having to visit multiple vendor websites. Whether you’re part of a small marketing team or a large enterprise, the directory has tools for a range of needs.
The Ultimate Guide to No-Code Tools for Business Owners
How to Implement No-Code Analytics Automation
Once you've chosen the right no-code analytics tools and resources, the next step is putting them into action. Here's how to do it effectively.
Planning and Defining Your Requirements
Before diving in, pinpoint the business decisions that need quicker insights. Focus on recurring, high-priority tasks like tracking daily campaign budgets, identifying activation drop-offs, or spotting churn signals. These are the areas where automation can deliver the fastest results, offering the speed and reliability needed for actionable insights [12][4].
Make a comprehensive list of your data sources and confirm access rights early on. Whether it's your CRM, ad platforms, web analytics, or ERP, knowing who can access each system avoids unnecessary delays later [13][3].
Two things are essential before you start building: clear metric definitions and stakeholder needs. For example, define what "revenue" or "conversion" means specifically for your business. Then, determine who needs to see the reports (executives, analysts, etc.) and how often they need updates (real-time or daily). Marketing teams, for instance, spend roughly six hours per week on manual reporting tasks [8]. Detailed planning upfront can reclaim that time.
| Planning Phase | Key Activities |
|---|---|
| Discovery | Identify key use cases; list data sources; define roles |
| Definition | Standardize metrics; set refresh schedules; establish security rules |
| Validation | Test data accuracy with parallel pulls; audit API consistency |
| Execution | Build dashboards; provide training; set up reporting routines |
With these steps in place, you can move on to designing workflows.
Building and Managing Workflows
Start small by automating a single, high-frequency report - like daily ad spend - before tackling more complex tasks like multi-channel attribution [13][8]. This approach simplifies the process and builds confidence in the system's output.
Leverage pre-built connectors to handle repetitive tasks like authentication, rate limiting, and pagination. This eliminates much of the engineering workload [5]. Match your data pipeline to your needs: batch ETL works for daily executive summaries, while streaming ELT is better for real-time dashboards [5].
To ensure consistency, build workflows with idempotency in mind. This ensures repeated runs produce identical results, avoiding duplicate data or errors. Add retry logic for temporary issues and set up alerts for permanent errors [5].
For example, in May 2026, NBBC Group, a performance marketing agency, reduced their report-building time by 75% using Looker Studio Pro paired with Funnel.io. Founder Nicolas Plunkett highlighted how Gemini AI's slide-generation feature saved each marketer two to five hours weekly, allowing the agency to quadruple its client load without adding staff [14].
"The Gemini AI slides feature is a clear time-saver, saving our marketers two to five hours a week each." - Nicolas Plunkett, Founder, NBBC Group [14]
Once workflows are operational, it's critical to maintain data accuracy and compliance.
Maintaining Data Quality and Compliance
The reliability of automated pipelines depends entirely on the quality of the data flowing through them. Automate checks for schema, range, completeness, freshness, and referential integrity. These safeguards can ensure up to 99.9% data accuracy [5].
One common issue is schema drift - when a source API changes its field names or structure - accounting for 46% of data integration complaints [5]. Tools like Improvado can save schema snapshots to avoid disruptions caused by API updates. In 2026, Booyah Advertising used Improvado's automated pipeline to achieve 99.9% data accuracy and cut their daily budget pacing cycle time in half across multiple platforms [5].
When it comes to compliance, focus on security at the architecture level. Relying solely on UI-based restrictions can leave gaps. Use row-level security, column masking, and role-based access control (RBAC) to ensure users only see data they're authorized to access [1][15]. For instance, U.S. companies following CCPA regulations must ensure junior staff can't access sensitive customer or payment data [15]. For critical actions like sending emails or processing payments, include manual approval steps to prevent errors [15][16].
"Governance must be enforced architecturally, not through UI restrictions that a curious user can work around." - Anton Melander, Ronja [1]
Advanced Use Cases and Trends in No-Code Analytics Automation
AI Features in No-Code Automation Platforms
No-code platforms have moved well beyond basic automation triggers, now incorporating AI systems capable of setting goals, planning steps, and executing tasks with minimal human intervention [15]. By 2026, it's expected that 80% of enterprise applications will feature at least one AI agent, a significant leap from just 33% in 2024 [18].
These advancements are already proving their worth. For example, in April 2026, a growth marketing manager at a SaaS company used Ryze AI to address a sudden 45% drop in conversion rates at 2 AM on a Sunday. The AI agent not only detected the anomaly in real time but also implemented corrective actions, saving the company $8,000 in potential revenue loss - all before the workweek began [19].
"AI agents for Google Analytics automated insights and action transform raw data into strategic decisions in real-time." - Ira Bodnar, Ryze AI [19]
AI capabilities in no-code platforms are evolving through clear stages: from manual dashboards created in tools like Databox to guided exploration, natural language queries, and finally Level 4 agentic analytics. At this level, systems proactively monitor metrics, issue alerts, and take action without user prompts. While most teams today operate between Level 2 and Level 3, Level 4 is quickly becoming the gold standard for forward-thinking marketing teams.
This shift in AI functionality is paving the way for deeper, more seamless integration into modern data ecosystems.
No-Code Tools and the Modern Data Stack
No-code tools are now tightly embedded within the modern data stack, thanks in large part to innovations like the Model Context Protocol (MCP). MCP is an open standard that allows AI agents to connect directly to platforms like GA4, HubSpot Analytics, and Salesforce without requiring custom middleware. By April 2026, MCP had been downloaded 97 million times and was actively running on over 9,400 public servers [18].
"The problem with traditional APIs is that they are bespoke... MCP changes the game by standardizing the way AI 'reads' an application's capabilities." - Jason Lemkin, Founder of Saastr [20]
Another key development is the rise of the semantic layer, which tools like dbt MetricFlow use to mediate between raw data warehouses and AI agents. This ensures metrics like "ROAS" or "CAC" are calculated consistently across dashboards, reports, and AI queries [17]. Without a semantic layer, teams risk conflicting metrics, which can undermine trust in analytics.
"In 2024, the semantic layer was a nice-to-have. By 2026, with agents reading from the data layer directly, it is the only thing standing between your AI and confidently wrong answers." - David Lopes, Polar Analytics [6]
These tools and standards are helping businesses maintain a reliable and consistent analytics framework, which is critical for scaling operations effectively.
Scaling Your No-Code Analytics Practice
Scaling no-code analytics requires a solid foundation that can handle growing complexity. A common pitfall is rushing to automate too many processes without proper governance.
A smarter approach is to use the automation maturity model: start with simple, rule-based workflows for predictable tasks, gradually add AI-driven decision-making, and only adopt fully autonomous agents once you're confident in the system's reliability [15]. Companies that combine visual builders with AI agents report reductions in manual processing time of 40%–70% [15].
Cross-team collaboration is often the biggest challenge when scaling. The solution lies in establishing a shared semantic layer with around 12 core metrics - such as Net Revenue, CAC, and LTV - defined once and used consistently across teams and tools [6]. Regularly monitor agent accuracy and human override rates to catch potential issues before they impact decisions [15]. When prioritizing departments for automation, start with marketing and operations, as they typically deliver the highest ROI within 12 months, ranging from 143% to 217% [15].
Conclusion: Key Takeaways
No-code analytics automation is reshaping how businesses in the U.S. handle their data. Companies that embrace no-code and low-code solutions are seeing big wins: cutting development costs by an average of 40% [3], slashing manual reporting time by 75%, and answering follow-up questions ten times faster compared to traditional BI workflows [4]. Marketing and operations teams, in particular, are seeing impressive returns, with a 12-month ROI ranging from 143% to 217% [15]. However, achieving these results depends heavily on having solid metric governance in place.
The foundation of success lies in governance. By defining key metrics - like CAC, ROAS, and LTV - before choosing tools, businesses can avoid inconsistent reports and misleading insights that erode trust in analytics [6].
"The real win isn't just saving time. It's building a culture where teams can move with confidence, experiment more freely, and make smarter decisions without waiting on someone else to 'unlock' the data for them." - Esha Shabbir [2]
This guide emphasizes the importance of combining automation with strong governance to enable faster, smarter decision-making. If you're exploring analytics tools, the Marketing Analytics Tools Directory is a helpful resource. It organizes tools by use case - whether you need automated reporting, real-time analytics, A/B testing tools, or audience insights - so you can evaluate options based on integration capabilities and your specific goals. With 81% of top-performing marketing teams leveraging advanced analytics platforms and being 2.4x more likely to outpace their competitors [21], choosing the right tool is a critical step in staying ahead.
FAQs
What’s the fastest first report to automate with no-code analytics?
Start by focusing on a straightforward, frequently-used report - something like daily orders or ad spend. This approach allows you to establish a dependable system without overcomplicating things. Tools that require no coding, such as Google Sheets or AI-driven dashboards, can streamline the process. They can instantly handle calculations like Return on Ad Spend (ROAS) and Cost Per Acquisition (CPA). Plus, they make it simple to link your data sources and produce polished, professional reports with minimal effort.
How do I prevent metric mismatches when more teams start self-serve reporting?
To prevent discrepancies in self-serve reporting, it's crucial to establish a centralized semantic layer with standardized, approved definitions. Start by defining key KPIs in a shared repository, ensuring they have clear ownership and accountability. Protect core metrics by locking them to avoid unauthorized edits, while allowing flexibility for exploratory metrics to encourage innovation. Additionally, hold weekly quality reviews where analysts and business users collaborate to address inconsistencies and maintain alignment. This practice helps minimize semantic drift across teams and ensures everyone stays on the same page.
How can I avoid runaway warehouse costs as query volume grows?
To keep warehouse expenses in check as query demand grows, consider adopting a cache-first architecture. This approach uses materialized views and pre-aggregations to power dashboards efficiently, reducing the strain on your data warehouse.
Here are some practical steps to optimize costs:
- Enforce Query Discipline: Use
WHEREclauses to filter data, partition and cluster tables for better performance, and avoid usingSELECT *to limit unnecessary data retrieval. - Monitor and Cap Spending: Set up resource monitors or budget alerts to automatically control and limit expenses.
- Choose Batch Loading: Opt for batch loading instead of real-time streaming to reduce computational overhead.
- Centralize Metrics: Use a semantic layer to unify metrics, making queries more streamlined and consistent.
These strategies help ensure your system remains efficient and cost-effective, even as query volume increases.