Monitoring cloud-integrated legacy systems is a complex challenge. These systems combine outdated infrastructure with modern cloud platforms, creating gaps in visibility, performance tracking, and incident response. Key problems include:
- Fragmented Monitoring Tools: Most organizations use multiple tools that don’t integrate well, leading to inefficiencies during incidents.
- Limited Legacy System Metrics: Older systems often lack the telemetry modern tools rely on, creating "black holes" in monitoring.
- Middleware and Network Blind Spots: Critical integration points like API gateways and transmission queues are often overlooked, causing unnoticed failures.
- Compliance Risks: Legacy systems struggle to meet modern data security and regulatory standards, increasing the risk of breaches and fines.
Solutions:
- Centralized Monitoring Platforms: Use tools like OpenTelemetry to unify metrics, logs, and traces across systems.
- Phased Instrumentation: Gradually add monitoring to legacy systems to avoid disrupting fragile codebases.
- Middleware and Network Monitoring: Focus on flow-level metrics and ensure telemetry headers are preserved across systems.
- Compliance Alignment: Secure data pipelines with encryption, masking, and retention policies to meet U.S. regulations like PCI DSS and HIPAA.
By addressing these challenges step by step, organizations can improve visibility, reduce downtime costs (averaging $5,600 per minute), and align IT performance with business goals, such as top marketing analytics tools for data accuracy.
Monitoring as Code: Managing your Observability Assets the Cloud-Native Way - Jose Javier Alonso
sbb-itb-5174ba0
Common Performance Monitoring Challenges in Cloud-Integrated Legacy Systems
Combining legacy systems with modern cloud platforms creates a host of monitoring challenges. The contrasting architectures often expose gaps in visibility and performance tracking. Let’s dive into some of the most common hurdles.
Fragmented Visibility Across Legacy and Cloud Components
Most organizations rely on multiple monitoring tools, not just one. For example, cloud-native platforms like Amazon CloudWatch often work alongside legacy application performance monitoring (APM) tools and network monitors. The problem? These tools don’t communicate well with one another. When incidents occur, engineers find themselves switching between dashboards, trying to piece together timelines from systems that were never designed to integrate.
This issue, often referred to as tool sprawl, limits teams from gaining a complete, unified view of their hybrid environments. Without this comprehensive oversight, no single team fully understands what’s happening across the entire stack.
"Legacy systems rarely fail due to a single error. The real risk lies in a lack of transparency: teams recognize the symptoms, but cannot identify the root cause." - 7P Group [2]
Hybrid environments often experience performance issues at integration points, such as API gateways or data handoff layers. Unfortunately, standard monitoring tools frequently overlook these critical boundaries. As a result, dashboards may look fine, but underlying transactions fail unnoticed.
Adding to the challenge, many legacy systems lack proper instrumentation to provide the necessary visibility.
Insufficient Metrics and Instrumentation in Legacy Applications
Legacy systems were built in an era before modern observability standards. Many don’t produce structured logs, lack distributed tracing, and fail to expose the granular metrics that today’s monitoring tools rely on. This creates what’s often called the "black hole" effect - you know something is wrong, but you can’t pinpoint the cause.
For instance, the absence of correlation IDs makes it nearly impossible to trace a single request as it moves from a cloud-based frontend to a legacy backend. This lack of traceability compounds the problem, especially since 77% of IT teams already report limited visibility across their hybrid environments [8].
Making matters worse, legacy codebases are often considered too fragile to modify. Teams worry that adding instrumentation might disrupt critical functions that haven’t been touched in decades. As Lukasz Ciukaj of Splunk explains:
"In almost every established enterprise, there's THAT one system... It's reliable, but it's also a complete black box. No one wants to touch it for fear of breaking it." [7]
This hesitation leaves significant telemetry gaps. Logs typically capture only 40–60% of the data needed during a legacy system incident. The remaining information is often buried in uninstrumented infrastructure states or thread dumps [5].
Middleware and network layers add yet another set of challenges.
Middleware and Network Bottlenecks in Hybrid Architectures
Middleware is a critical yet often overlooked layer in hybrid system monitoring. For instance, in mainframe-to-cloud integrations, the Transmission Queue (XMITQ) bridges the two environments. If the cloud channel stalls, it can back up the queue and cause transaction failures - even when server health checks report no issues.
"Monitoring the host is not monitoring the middleware. Server Monitoring tells you the z/OS LPAR is up and running. Middleware Monitoring tells you that the CICS Transaction Gateway is rejecting requests." - John Ghilino, Avada Software [9]
Network-level challenges further complicate hybrid environments. VPN tunneling and reduced MTU limits introduce additional overhead. Asymmetric routing, where return traffic takes a different path than outbound traffic, can result in intermittent session drops. These errors are notoriously difficult to reproduce and are often missed by standard health checks.
External factors, such as DNS resolver outages or CDN misconfigurations, add even more unpredictability. This explains why 45% of organizations have experienced business interruptions tied to third-party dependencies in the past two years [3].
Together, these challenges highlight the complexity of monitoring hybrid systems and the need for more integrated and transparent solutions.
How to Monitor Cloud-Integrated Legacy Systems More Effectively
Managing cloud-integrated legacy systems often comes with challenges like fragmented visibility, uninstrumented legacy code, and middleware blind spots. These hurdles can be tackled through centralized tools, phased instrumentation, and comprehensive flow mapping.
Using Centralized Observability Platforms and Open Standards
A centralized platform that consolidates metrics, logs, and traces into a single view can save time and eliminate the inefficiencies caused by switching between dashboards. OpenTelemetry (OTel), a vendor-neutral standard, is key to achieving this. As the second most active project in the Cloud Native Computing Foundation (CNCF) after Kubernetes [10], OTel enables seamless telemetry collection across diverse systems, including Kubernetes pods, bare-metal servers, and mainframes. Its use of traceparent headers ensures uninterrupted trace context from cloud-native frontends to legacy backend systems, removing broken traces.
A notable example of this approach was demonstrated in February 2026 when IBM and Elastic integrated IBM Z Observability Connect with Elastic Observability. This integration allowed mainframe CICS transactions to emit OTLP-formatted traces to an Elastic Cloud endpoint, enabling full-stack traceability from React frontends to IBM Z backends [10].
"With IBM Z Observability Connect, the Elastic Managed OTLP Endpoint, and Elastic APM, your entire stack can finally speak a single language: OpenTelemetry." - Sherry Ger, Alexander Wert, and Micah Gafford [10]
To implement this, deploy an OTel Collector in each network zone (both on-premise and cloud) as a secure gateway. Use file-based persistent queues to buffer telemetry during network instability, ensuring data continuity [11].
Adding Instrumentation to Legacy Systems in Phases
Legacy systems often come with fragile codebases, making phased instrumentation essential. Start by monitoring basic health metrics like CPU usage, memory utilization, and garbage collection. Once stable, expand to include latency, throughput, and error rates for critical business transactions [7].
For Java applications, the OpenTelemetry Java agent can be attached using the -javaagent JVM argument. Setting OTEL_SERVICE_NAME allows you to capture metrics without modifying the source code [7]. To avoid performance issues, focus on selective instrumentation. For instance, target specific packages or classes, like com.company.billing.*, rather than enabling observability across all methods.
As Saulo Santos, Enterprise Java Leader, explains:
"If every single method was enabled for observability, we wouldn't only get a lot of noise... but it would also cause the application performance to degrade and quite severely." - Saulo Santos, Enterprise Java Leader [6]
For systems that generate plain-text log files, OTel Collectors can parse these logs using regex patterns, converting them into structured and queryable metrics. This approach addresses visibility gaps, as logs often reconstruct only 40–60% of incidents in production [5].
Once the core systems are instrumented, the focus can shift to monitoring middleware and network performance.
Monitoring Middleware and Network Performance End to End
Middleware and network layers often introduce blind spots. To address these, focus on flow-level metrics that reflect real transaction behavior, rather than relying solely on server health checks.
For middleware, prioritize monitoring three key signals:
- Transmission Queue (XMITQ) depth and rate of change: This helps detect potential bottlenecks.
- Channel status: Pay attention to "Retrying" statuses, which may indicate broken links.
- Serialization segments: These occur when parallel cloud calls are forced into sequential processing by legacy systems [9].
Alerting on the rate of change in queue depth, rather than static thresholds, provides earlier warnings of potential issues.
"Monitoring the host is not monitoring the middleware. Server Monitoring tells you the z/OS LPAR is up and running. Middleware Monitoring tells you that the CICS Transaction Gateway is rejecting requests." - John Ghilino, Avada Software [9]
At the network level, ensure that proxies and firewalls allow OTel headers (traceparent, tracestate, baggage) to pass through without being stripped. If legacy protocols can't carry these headers, create synthetic trace IDs by fingerprinting stable fields like User ID, Resource ID, and operation type [5]. For mainframe environments, agentless monitoring tools provide a safer alternative to installing agents directly on the system, reducing both MIPS costs and stability risks [9].
Connecting System Performance Metrics to Marketing Analytics Goals
Once your middleware and network layers are set up with proper instrumentation, the next challenge is ensuring the technical data serves a purpose beyond the IT department. The key is to bridge the gap between system performance metrics and marketing objectives. Without this alignment, the full potential of these metrics often goes unrealized.
Setting SLOs and SLIs That Reflect Marketing Analytics Needs
Instead of focusing solely on traditional SLIs like uptime or response codes, shift attention to metrics that impact marketing directly. For example, track data quality metrics such as lead ingestion success rates, attribution accuracy, and schema validation. Your SLOs should reflect business goals - like ensuring that 99% of high-intent leads are successfully added to the CRM within five minutes, complete with accurate attribution details [13].
"A campaign can only be considered successful if every required event and field lands where it should: click, form submit, consent state, UTM parameters, identity resolution, lead routing, CRM creation, enrichment, and owner assignment." - Jamie Pagan, Leadfeeder [13]
This means every single field - whether it's consent state, identity resolution, or source attribution - needs to meet specific latency and accuracy standards, not just pass basic transport-level checks.
Building Dashboards That Combine Technical and Business Metrics
Separate dashboards for IT and marketing often result in fragmented insights. Instead, unified dashboards that combine technical and business metrics create a shared understanding. A three-tier layout works well:
- Top tier: Displays the overall pipeline status.
- Middle tier: Focuses on channel-specific performance.
- Bottom tier: Highlights detailed anomaly insights, including a sales actionability panel showing the percentage of records accepted without manual corrections [13][14].
Each key metric should be paired with its target, a comparison to a previous period, and a variance indicator. This setup helps both IT and marketing teams quickly identify how system performance is influencing campaign results.
Finding the Right Tools with the Marketing Analytics Tools Directory
The Marketing Analytics Tools Directory is a great resource for navigating the wide range of solutions available. Whether you're looking for lightweight reporting tools or advanced platforms, the directory simplifies the process of finding tools that support critical needs like server-side tracking, identity resolution, and unified attribution across hybrid cloud and legacy systems.
Governance and Compliance When Monitoring Legacy Systems in the Cloud
On-Premise vs. Cloud vs. Federated Monitoring: Key Trade-offs for Legacy Systems
When managing hybrid monitoring systems that span both technical and business domains, governance plays a critical role in ensuring data security and meeting regulatory standards. Monitoring pipelines must not only track system performance but also safeguard sensitive information to comply with U.S. regulations. Telemetry streams can unintentionally include sensitive data like PII, PHI, or PCI in plain text. A single misconfigured log sink can escalate a standard observability setup into a reportable data breach. Consider this: the average cost of a data breach in the U.S. hit $10.22 million in 2025 [15][16], and the cost of exposing just one record is estimated at $160 [16]. This makes governance a top priority, not an afterthought.
Building Security Into Your Monitoring Architecture
To secure hybrid monitoring environments, three foundational controls are essential: encryption in transit and at rest, role-based access control (RBAC), and local sensitive data masking. Among these, data masking is often overlooked. Tools like Fluent Bit or custom log sinks can redact sensitive information - such as Social Security numbers or credit card details - before telemetry leaves on-premise systems [12]. This ensures that downstream tools like SIEMs or data lakes don’t ingest raw sensitive data [18].
Another critical step is configuring write-once storage with cryptographic hashing, which aligns with NIST SP 800-92 standards to create tamper-evident logs [19].
"Observability is not only a technical problem - it's a people, process, and policy problem." - Avery Thornton, Senior Editor & DevOps Strategist [22]
From here, it’s vital to align telemetry practices with U.S. compliance standards.
Aligning Telemetry Practices with U.S. Compliance Requirements
U.S. regulations impose strict rules on how monitoring data is collected, stored, and retained. The table below highlights some key regulations, their monitoring requirements, and common failure points in legacy systems.
| Regulation | Key Monitoring Requirement | Common Legacy Failure Mode |
|---|---|---|
| PCI DSS 4.0 | Critical patches within 30 days; 12-month log retention (Req 6.3.3) | Lack of patch pipelines for end-of-life (EOL) systems [15] |
| NYDFS Part 500 | Documented asset support expiration dates; CEO/CISO co-signature | EOL technology creates automatic compliance issues [15] |
| HIPAA | Audit trails for ePHI access (45 CFR § 164.312); 6 years of retrievable logs | Legacy APIs often lack structured attribution [17][20] |
| FedRAMP | 90 days online / 1 year total log retention | High costs for storing uncompressed legacy logs [19] |
| SOX Section 802 | 7-year retention of audit-related records | Proprietary log formats are hard to maintain over time [19] |
One recent enforcement case underscores the stakes: in August 2025, the New York Department of Financial Services issued a $2 million consent order against Healthplex for failing to comply with NYDFS Part 500, citing poor oversight of legacy systems [15]. Similarly, in December 2024, Flagstar Bank settled with the SEC over a misleading cybersecurity disclosure in a Form 8-K, highlighting that failing to address known vulnerabilities in legacy systems is a growing area of federal enforcement [15].
"The moment a regulation mandates a control a system cannot produce, the organization is out of compliance. Not accumulating risk. Not operating in a gray area. Out of compliance." - Keerthi Murali, Customer Delivery Manager, LegacyLeap [15]
Given these stringent requirements, choosing where to aggregate your monitoring data becomes a critical decision.
On-Premise vs. Cloud Monitoring: Trade-offs to Consider
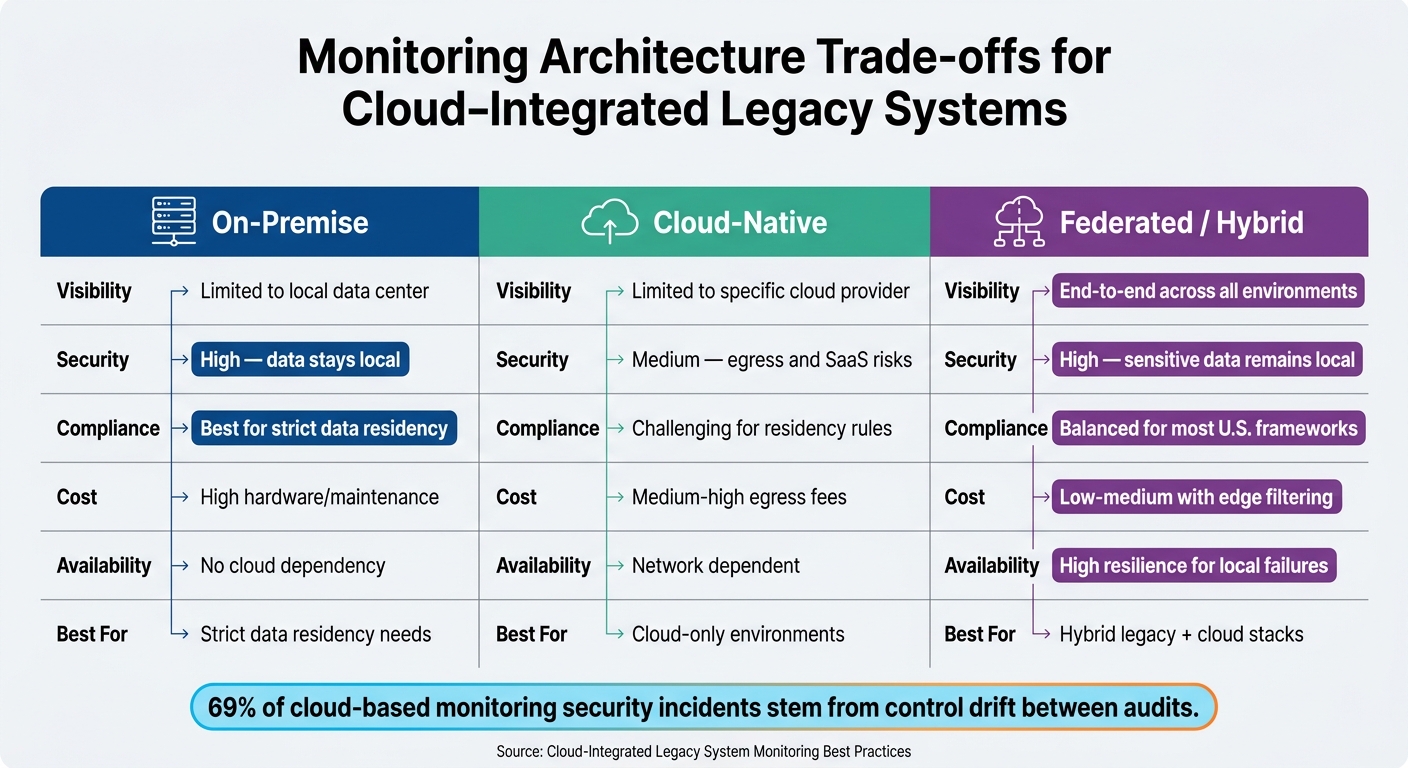
There’s no one-size-fits-all answer to where monitoring data should be aggregated. The choice depends on factors like regulatory needs, operational complexity, and budget. A hybrid or federated model often strikes the best balance: sensitive raw telemetry stays on-premise to meet data residency rules, while aggregated, anonymized meta-events are sent to a cloud coordinator to cut egress costs [18].
| Feature | On-Premise | Cloud-Native | Federated / Hybrid |
|---|---|---|---|
| Visibility | Limited to local data center | Limited to specific cloud provider | End-to-end across all environments [4][1] |
| Security | High - data stays local | Medium - egress and SaaS risks | High - sensitive data remains local |
| Compliance | Best for strict data residency | Challenging for residency rules | Balanced for most U.S. frameworks [1][12] |
| Cost | High hardware/maintenance | Medium-high egress fees | Low-medium with edge filtering [18] |
| Availability | No cloud dependency | Network dependent | High resilience for local failures |
It’s worth noting that 69% of cloud-based monitoring security incidents stem from control drift between audits [21]. Shifting to continuous compliance monitoring, rather than relying on annual assessments, directly tackles this issue. Regulators and cyber insurers are increasingly expecting this proactive approach.
Conclusion: Key Takeaways for Monitoring Cloud-Integrated Legacy Systems
Keeping an eye on cloud-integrated legacy systems can feel like a tall order, but breaking it into manageable steps makes it achievable. The main hurdle - fragmented visibility - calls for a disciplined approach that combines open standards, phased instrumentation, and governance aligned with compliance requirements.
OpenTelemetry is an excellent starting point. It serves as a universal connector for traces, metrics, and logs, whether your systems rely on IBM mainframes or Kubernetes microservices [10]. Pair this with non-invasive instrumentation to illuminate legacy "black boxes" without altering the original code [6][7]. Then, roll out your monitoring in stages: begin with basic health indicators like CPU and memory usage, gradually add metrics like latency and error rates, and finally tie in business-level metrics [7]. This step-by-step process not only sharpens operational insights but also boosts marketing outcomes.
The last phase ties everything together. Technical performance and marketing goals go hand in hand. Consider this: downtime costs average $5,600 per minute [1], and slow-loading pages can directly hurt your conversion rates. By setting SLOs (Service Level Objectives) that align with business needs - like ensuring fast checkout page response times using tools like FoxMetrics - you transform observability from a purely IT concern into a shared business priority.
"Observability is not just an operational tool - it is a strategic enabler of modernization." - Saulo Santos, Enterprise Java Leader [6]
Building on earlier suggestions around middleware and compliance, a federated monitoring model offers a balanced solution. By keeping sensitive telemetry data on-premise while sending anonymized meta-events to the cloud, you can strike a balance between security, cost efficiency, and compliance. This approach works well under most U.S. frameworks, even as regulators address compliance gaps in legacy systems.
FAQs
What’s the fastest way to get end-to-end visibility without replacing existing monitoring tools?
The fastest path to achieving full visibility across your systems is by leveraging a centralized observability platform that acts as a single pane of glass. For older applications, tools like OpenTelemetry Java agents can gather telemetry data without requiring any code changes. In more complex environments, using an iPaaS or unified monitoring platform brings together metrics, logs, and traces into a single dashboard, making it easier to analyze and manage even the most fragmented setups.
How can we add tracing to a legacy app without modifying its code?
To implement distributed tracing in legacy systems without altering the existing code, you can rely on non-invasive instrumentation methods. For example, you can attach an instrumentation agent, like the OpenTelemetry Java agent, during startup by configuring environment variables or adding JVM flags.
Another option is to use dynamic instrumentation tools such as Datadog, BTrace, or Instana. These tools allow you to inject probes into running processes, enabling trace collection without modifying the system's core code.
Alternatively, deploying an API gateway can help monitor traffic and gather trace data externally. This approach keeps the core system untouched while still providing valuable insights into system performance and behavior.
How can we prevent logs and traces from exposing PII, PHI, or PCI data in the cloud?
Protecting sensitive data in cloud logs requires a layered approach. Here's how you can minimize risks:
- Log Only Non-Sensitive Identifiers: Avoid logging sensitive information altogether. Stick to non-sensitive identifiers that fulfill your operational needs.
- Enforce Code Reviews: Implement strict code review processes to catch potential logging mistakes before they make it to production.
- Apply Linting Rules: Use linting tools to automatically flag improper logging practices during development.
When it comes to handling sensitive fields during transit, take proactive measures like masking, hashing, or dropping them. Tools such as Fluentd or native cloud services can help you manage this effectively.
Additionally, secure your log infrastructure by implementing these measures:
- Role-Based Access Control (RBAC): Restrict access to logs based on user roles to ensure only authorized personnel can view sensitive data.
- Encryption: Encrypt logs both at rest and during transit to prevent unauthorized access.
- Automated Retention Policies: Set up automated policies to control how long logs are stored, reducing the risk of unnecessary data exposure.
By following these steps, you can significantly reduce the chances of sensitive data leaking through your cloud logs.