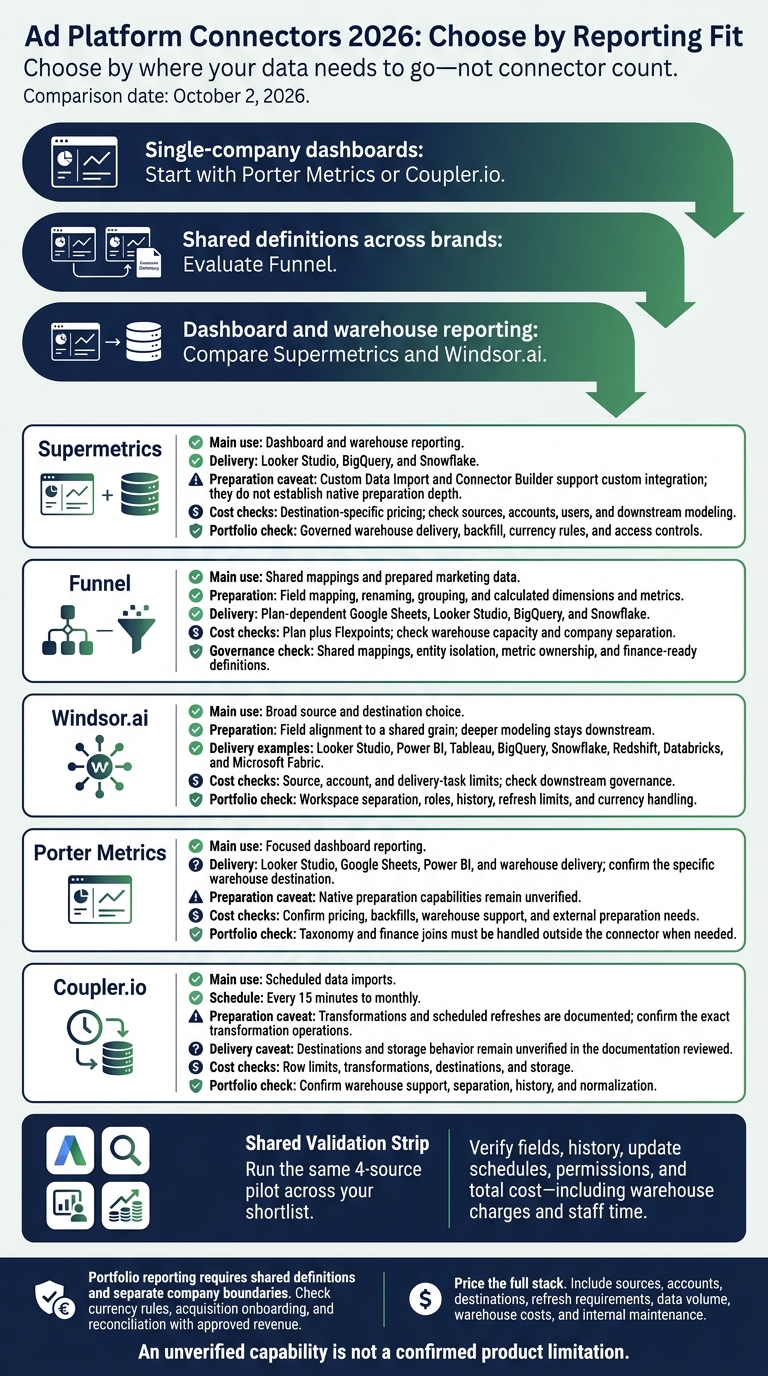
I would choose an ad connector by where your data needs to go, not by connector count. For single-company dashboards, start with Porter Metrics or Coupler.io. For shared definitions across brands, evaluate Funnel. For dashboard and warehouse reporting, compare Supermetrics and Windsor.ai.
I compare all 5 tools on source coverage, pricing, data preparation, delivery, and governance. For PE-backed teams, I also check company separation, currency rules, acquisition onboarding, and whether ad spend can be reconciled with approved revenue.
Quick Comparison
| Tool | Main use | Cost and setup checks |
|---|---|---|
| Supermetrics | Dashboard and warehouse reporting | Destination-specific pricing; check sources, accounts, users, and downstream modeling |
| Funnel | Shared mappings and prepared marketing data | Plan plus Flexpoints; check warehouse capacity and company separation |
| Windsor.ai | Broad source and destination choice | Source, account, and delivery-task limits; check downstream governance |
| Porter Metrics | Focused dashboard reporting | Confirm pricing, backfills, warehouse support, and external preparation needs |
| Coupler.io | Scheduled data imports | Check row limits, transformations, destinations, and storage |
Comparison date: October 2, 2026. Prices in the article are in U.S. dollars.
Before buying, I would run the same 4-source pilot across your shortlist: 2 ad platforms, 1 analytics or CRM source, and 1 revenue or finance reference. <u>Verify fields, history, update schedules, permissions, and total cost</u> - including warehouse charges and staff time. Missing documentation is a reason to test, not proof that a feature is absent.
Ad Platform Connectors 2026: Choose by Reporting Fit
Top Facebook Ads Connectors for Looker Studio – Which One is Right for You?
sbb-itb-5174ba0
1. Supermetrics
Supermetrics gives teams one connector layer for dashboard and warehouse reporting, making it a general-purpose option for both workflows.
Source Coverage and Extraction
Supermetrics covers social media, search engines, email, and CRM data.[6] Teams can bring paid media, social, email, and CRM data into one reporting layer.
Pricing
Supermetrics prices by destination, so costs depend on the reporting tool or warehouse receiving the data.[6]
Data Preparation and Governance
Supermetrics centralizes channel data for campaign reporting, attribution, and website analytics tools workflows.[6]
Warehouse and Dashboard Delivery
Supermetrics supports Looker Studio, BigQuery, and Snowflake for dashboard-first reporting and warehouse pipelines.[6] These delivery options make it worth evaluating across reporting stacks, though fit depends on each stack’s workflow requirements. For more options, see our curated list of top analytics tools and resources.
2. Funnel
Funnel is a marketing data hub with strong normalization and delivery options. Its capacity-based pricing changes with usage.[13][8]
Source Coverage and Extraction
Funnel combines managed connectors, normalization, native storage, and delivery to BI tools and warehouses.[13] It says it connects to 600+ platforms, but its pricing materials list 117 connectors. Availability depends on the plan and account.[4][14]
Before buying, confirm source support, required fields, historical lookback, quota limits, and update frequency. These checks matter when multiple brands, account structures, and attribution rules need to stay aligned across reporting cycles.
Back-test the last 30 days against native reports. Check late conversions, renamed or deleted campaigns, and attribution-window changes. A large connector catalog helps only if its fields, history, and update schedule fit your reporting needs.
Pricing and Limits
Funnel uses Flexpoints, with usage tied to connectors, accounts, and destinations. Warehouse delivery consumes more capacity than dashboard delivery, so assess cost against where the data will go.[8][4][7] Public materials list a 400-point minimum and 100-point increments. Request a current quote for your exact mix of brands, accounts, and destinations.[8][9][10][11]
Data Preparation and Governance
Built-in preparation supports field mapping, renaming, grouping, and calculated dimensions and metrics to keep definitions consistent.[12][13] Normalization doesn't make platform metrics identical. Validate attribution windows, time zones, and conversion rules before combining data.
For mid-market and PE-backed reporting, assign owners for channel definitions and transformation changes, review workspace permissions, and keep source-reported conversion data separate from finance-validated revenue. Funnel is a strong fit when teams need consistent definitions before data reaches a dashboard or warehouse.
Warehouse and Dashboard Delivery
Funnel delivers prepared data to Looker Studio and Google Sheets, or to warehouses such as BigQuery and Snowflake.[4][7] Use dashboards for scorecards. Choose warehouse delivery when marketing data needs to join CRM, billing, product, or ledger data. Native storage helps standardize history across brands and reports.[13]
During the pilot, verify retention, update latency, export limits, and warehouse Flexpoint cost. Compare easier delivery and preparation with the tighter control available in a downstream warehouse model.[7]
3. Windsor.ai
Windsor.ai is best for broad source coverage and flexible data delivery, but it offers less built-in governance than Funnel.
Source Coverage and Extraction
Windsor.ai says it supports 350+ data sources, including Google Ads, Meta/Facebook Ads, LinkedIn Ads, TikTok Ads, Google Analytics 4, Shopify, and HubSpot.[18][19] Check the live catalog for the fields you need, historical access, and connector behavior. Sources and accounts have separate caps, which matters when managing multiple ad accounts across brands.[15]
Pricing and Limits
The live pricing page starts at $19/month for 1 source and 1 account. Higher tiers include $99/month for 3 sources and 75 accounts, $249/month for 7 sources and 75 accounts, and $499/month for 10 sources and 200 accounts.[15] Before budgeting, verify whether your plan uses MAR limits or the newer unlimited-row policy.[16][17]
Unlimited BI syncs do not mean unlimited exports. The $99 tier allows 5 destination tasks with daily updates. The $249 tier lists unlimited tasks with daily or hourly updates, while a higher tier adds 15-minute scheduling.[15] Check these limits as account structures and update frequency grow across brands.
Data Preparation and Governance
Windsor.ai can align fields to a single grain, but deeper modeling still belongs downstream.[18] Confirm which field-mapping steps the interface handles and which need SQL, Python, or warehouse modeling. For PE-backed and multi-brand reporting, verify account mapping, metric ownership and definitions, credential separation, edit permissions, and failed-sync logs.
Warehouse and Dashboard Delivery
Windsor.ai lists Looker Studio, Power BI, Tableau, Google Sheets, Excel, BigQuery, Snowflake, Redshift, Databricks, and Microsoft Fabric among its destinations.[1] Once fields and grain are aligned, choose where the data should land. For portfolio reporting, use a governed warehouse as the system of record. Verify whether each dashboard connection is direct or passes through an intermediate sheet or database.[1]
4. Porter Metrics
Porter Metrics suits teams that want simple, dashboard-first ad reporting without a heavier normalization layer.
Source Coverage and Extraction
Porter Metrics supports Facebook Ads, Instagram Ads, Google Ads, LinkedIn Ads, TikTok Ads, X Ads, Amazon Ads, Pinterest Ads, and Microsoft Ads. It works as a dashboard-first connector for Looker Studio, Google Sheets, Power BI, and warehouses. Before buying, check account caps, backfill limits, refresh frequency, and field coverage.
Pricing and Limits
Pricing depends on data sources and connected ad accounts. Request a quote that includes every connector, account, and added brand you need.
Data Preparation and Governance
Porter Metrics is a live connector, not a full data hub. Check which transformations the connector handles and which need external tools. PE-backed teams should also verify access controls, credential ownership, and whether historical data is stored outside the live connection.
Warehouse and Dashboard Delivery
Porter Metrics delivers data to Looker Studio, Google Sheets, Power BI, and data warehouses, with a focus on Looker Studio and Sheets. If you plan to use a warehouse, confirm support for your destination and check history retention. Dashboard access alone does not mean historical data is stored separately. The cost-and-prep comparison below focuses on these checks: delivery path and historical storage.
5. Coupler.io
Source Coverage and Extraction
Coupler.io supports Google Ads, Facebook Ads, LinkedIn Ads, TikTok Ads, Microsoft Ads, Pinterest Ads, Amazon Ads, and Quora Ads. Scheduled imports run every 15 minutes to monthly, while historical extraction supports multi-year backfills for trend and year-over-year (YoY) reporting.
Pricing and Limits
Row-based limits mean costs scale with data volume. Coupler.io is therefore a better fit for scheduled extracts than heavily governed pipelines. Use the comparison below to check whether those limits suit your account volume and reporting stack.
Data Preparation, Governance, and Delivery
Public documentation does not specify transformation, blending, destination options, or storage behavior. Verify these details before buying. The next section compares these documentation gaps with the stronger data preparation and delivery models other tools offer.
Compare Sources, Costs, Data Preparation, and Delivery
Compare source support, data preparation, delivery paths, and scaling costs - not connector counts alone. The tables below distinguish verified capabilities from documentation gaps and show how those differences affect cost and delivery.
Ad Sources and Extraction Limits
Treat undocumented support as unverified. Connector counts are not directly comparable.
The vendor profiles above cover source availability. Supermetrics’ API documentation explicitly names Google Ads, Microsoft Advertising, and Amazon Ads.[22] For each tool, check account limits, refresh depth, attribution handling, and historical backfill before buying.
| Extraction check | Check at source | Check in tool |
|---|---|---|
| Authentication | Credentials and account access | Permissions and credential ownership |
| Refresh/backfill | History and reporting delays | Schedule, backfill, reload window |
| Rate limits | API quotas and manager-account access | Query caps, pagination, account limits |
| Fields/breakdowns | Available dimensions and metrics | Supported field combinations |
| Attribution | Windows, conversions, time zones | Preserved versus calculated definitions |
| Deleted/modified campaigns | Deleted entities and revised results | Reloads, deduplication, partial loads |
Pricing and Scaling Costs
These are documented prices, not live quotes.
For portfolio reporting, price account counts and delivery paths rather than brand count alone. Total operating cost includes subscriptions, account/source/destination add-ons, warehouse and BI charges, implementation, and maintenance.[2][4][5]
| Tool | Documented USD price | Scaling drivers |
|---|---|---|
| Supermetrics | No universal price; destination-specific pricing[2] | Destinations, sources, accounts, users, and add-ons; no separate volume or query pricing documented[2] |
| Funnel | Agency entry: $300/month billed annually; higher agency tier: $600/month billed annually[7] | Subscription plus Flexpoints for connectors, accounts, and destinations; warehouse and visualization delivery use different amounts of capacity[4][7][8] |
| Windsor.ai | Free: $0. Monthly / monthly equivalent billed annually: Basic $23 / $19; Standard $118 / $99; Plus $298 / $249; Professional $598 / $499. Enterprise: custom[3] | Free includes 1 source, 1 account, 1 user, and 5 destinations. Higher tiers expand capacity; usage limits vary by plan. Enterprise lists up to 300 sources and 50,000 accounts.[3] |
Porter Metrics and Coupler.io do not publish verified pricing.
Compare these costs with the preparation work each tool handles and the work your team must do elsewhere.
Data Preparation and Governance
| Tool | Confirmed preparation or integration capabilities |
|---|---|
| Supermetrics | Custom Data Import and Connector Builder support custom integration; they do not establish native preparation depth.[23] |
| Funnel | Field mapping, renaming, grouping, and calculated dimensions and metrics.[12][13] Custom integration paths include SQL databases, APIs, SFTP, and managed file transfer.[21] |
| Windsor.ai | Field alignment to a shared grain; deeper modeling stays downstream.[18] |
| Coupler.io | Transformations and scheduled refreshes are documented; confirm the exact transformation operations.[20][24] |
Porter Metrics’ native preparation capabilities remain unverified. For every tool, confirm which operations run natively and which need spreadsheet formulas, BI calculations, or customer-owned SQL.
Destination choice also changes the workflow, not just the output format.
Warehouse and Dashboard Delivery
Choose dashboard-first for direct reporting, warehouse-first for downstream modeling, or hybrid for both. Specialized platforms like FoxMetrics provide real-time behavioral tracking to support these reporting models. A documented destination does not establish identical delivery mechanics, retention, or access isolation across tools.[1][4][21]
| Tool | Documented delivery paths | Operating-model fit |
|---|---|---|
| Supermetrics | Google Sheets, Excel, Looker Studio, Power BI, Supermetrics Storage, warehouses, cloud storage, and custom integrations[5][20][23] | Hybrid dashboard and warehouse workflows |
| Funnel | Plan-dependent Google Sheets, Looker Studio, BigQuery, and Snowflake delivery; custom SQL database, API, SFTP, and managed file-transfer paths[4][7][21] | Prepared data for dashboards or warehouse reporting |
| Windsor.ai | Sheets, Excel, Looker Studio, Power BI, Tableau, BigQuery, Snowflake, Redshift, Databricks, Fabric, databases, S3, Azure, and MCP[1] | Dashboard-first, warehouse-first, or hybrid delivery across many destinations |
| Porter Metrics | Looker Studio, Google Sheets, Power BI, and warehouse delivery; confirm the specific warehouse destination | Dashboard-first, with warehouse support to validate |
Coupler.io’s destinations and storage behavior remain unverified in the documentation reviewed.
Customer-owned warehouses put storage, query costs, modeling, and access control in the customer’s hands. Pass-through delivery needs a separate retention plan. Vendor-managed storage needs contractual retention and recovery terms. Before purchase, assign ownership for credentials, schema changes, failed refreshes, and dashboard definitions.
The next section compares each tool’s fit and trade-offs for dashboard-first, warehouse-first, and hybrid reporting.
Trade-Offs and Reporting Fit
Choose based on your operating model, not connector count.
Strengths and Limitations
An unverified capability is not a confirmed product limitation.
| Tool | Selection rule |
|---|---|
| Supermetrics | Choose when 1 tool needs to support both dashboard and warehouse workflows. |
| Funnel | Choose when standardized definitions matter more than connector breadth. |
| Windsor.ai | Choose when source and destination flexibility matters more than deep governance. |
| Porter Metrics | Choose for focused dashboard use with light governance needs. Dashboard templates do not provide portfolio governance. |
| Coupler.io | Choose for lightweight scheduled imports, not centralized reporting. |
Dashboard Connectors vs. Extraction Platforms vs. Data Hubs
| Architecture | Best fit | Main risk |
|---|---|---|
| Dashboard connector | Dashboard-first reporting for a single company or focused team | Dashboard calculations and templates do not establish shared definitions or company separation. |
| Extraction platform | Warehouse-first reporting with downstream modeling | Warehouse delivery alone does not establish reliable backfills, access controls, or finance-ready models. |
| Data hub | Multi-brand or portfolio reporting that needs shared definitions | Centralized data still needs an owner for definitions, company separation, and routine maintenance. |
Single-Company, Multi-Brand, and Portfolio Reporting
Portfolio reporting requires shared definitions and separate company boundaries. Test taxonomy reuse, historical comparability, currency normalization, and permissions. For PE-backed and mid-market portfolios, assign ownership of definitions and require entity isolation and consistent currency handling.
After an acquisition, onboarding should preserve company boundaries while applying shared definitions. Copied dashboards do not prove that CAC is comparable.
| Tool | Single-company dashboards | Multi-brand reporting | Portfolio reporting | Post-acquisition onboarding |
|---|---|---|---|---|
| Supermetrics | Candidate for direct reporting | Verify reusable setups and workspace permissions | Use only with governed warehouse delivery, backfill, currency rules, and access controls. | Moderate effort; standard schemas and templates can reduce rework. |
| Funnel | Fits recurring visualization delivery | Choose for shared taxonomy rules | Fits when shared mappings and entity isolation are required. | Moderate effort; standardized mappings help. |
| Windsor.ai | Choose when required sources are supported | Verify field consistency and account limits | Use only after validating workspace separation, roles, history, refresh limits, and currency handling. | Low to moderate effort for standardized sources; higher for differing schemas. |
| Porter Metrics | Fits focused dashboard workflows | Verify shared transformations beyond templates | Use only when taxonomy and finance joins are handled outside the connector. | Fast dashboard setup does not resolve historical or taxonomy differences. |
| Coupler.io | Fits lightweight scheduled reporting | Use when requirements and permissions align | Use only when warehouse support, separation, history, and normalization are confirmed. | Effort increases with different currencies, schemas, and finance joins. |
Once the reporting structure is set, test finance reconciliation.
Connecting Ad Spend to Revenue and Finance
Preserve stable identifiers and explicit data grain, not campaign names alone. Keep ad account and campaign IDs, CRM lead and opportunity IDs, customer or order IDs, and legal entity IDs.
Aggregate before joining so one-to-many joins do not inflate spend. Align fiscal periods, time zones, and attribution windows. Keep original currencies alongside the reporting currency, and use finance-approved exchange rates.
Keep platform ROAS and finance-reconciled ROAS separate. Platform ROAS uses platform-attributed conversion value. Finance-reconciled ROAS uses approved CRM, order, or finance revenue under a documented attribution policy. Both divide by ad spend. Check refunds, duplicates, modeled conversions, and timing before reconciliation.
Paid-media CAC divides ad spend by new customers attributed to paid media. Fully loaded CAC adds approved acquisition expenses, including personnel, creative, agency, and technology costs. Match period, entity, currency, and customer definitions across both inputs.
Marketing efficiency feeds margin and payback analysis, but connectors do not prove EBITDA impact.
Conclusion: Choose by Architecture and Pilot Results
Shortlist by architecture, then buy based on pilot results. Start with your required fields, governance needs, and destination. Compare tools by source coverage, transformation depth, delivery path, and finance-ready governance.
| Reporting need | Shortlist | Confirm before buying |
|---|---|---|
| Dashboard-first reporting | Porter Metrics or Coupler.io | Backfill depth, refresh frequency, and destination support. |
| Broad source coverage | Supermetrics | Required sources are covered in the selected plan. |
| Broad source coverage and attribution controls | Windsor.ai | Attribution features meet your measurement requirements. |
| Centralized preparation and governance | Funnel | Mapping rules, entity separation, destination controls, and finance-ready definitions. |
Test the shortlist against live accounts before purchase. Your pilot should check creative and campaign IDs, custom conversions, historical backfill, refresh reliability, granular permissions, OAuth access, and delivery to your production warehouse. Use these as acceptance tests, not assumed capabilities.
Price the full stack. Include sources, accounts, destinations, refresh requirements, data volume, warehouse costs, and internal maintenance in the architecture’s total cost. Low connector fees don’t always mean a low total cost.
For broader tool discovery, use the Marketing Analytics Tools Directory.[25]
FAQs
How can I estimate connector costs as we scale?
Budget for licensing fees, engineering maintenance, cloud warehouse compute credits, and financial risks from data quality errors. Allocate 5–7% of your marketing budget for startups, 7–10% for growth-stage businesses, and 10–15% for enterprises.
Set billing alerts at 80% of budget. Use daily syncs; higher-frequency updates can cost up to 12 times as much. Favor elastic infrastructure or consumption-based pricing to keep costs aligned with actual data volume.
How do I prevent duplicate data during backfills?
Choose integration tools with idempotent sync so recovery from failures doesn’t create duplicate records [1]. Look for automated duplicate removal, especially if your team has limited technical expertise [1].
Apply transformations during extraction or upstream to clean inconsistent data and remove redundant records before they reach your data warehouse [2].
For help choosing tools that fit your reporting needs, browse the Marketing Analytics Tools Directory.
Can I switch connectors without losing reporting history?
You can keep your reporting history if the new connector supports your existing warehouse and data structure. Many connectors require a specific warehouse, though, which can make switching costly and complex [1].
Access to older data may also be limited. Many ad platforms restrict export date ranges or charge extra for older data [2]. Before switching, check that the connector supports both your warehouse and the historical date range you need [1][2].