I start CLV architecture with the decision, not the model. Define what you predict - revenue, gross profit, or contribution margin - and who will use it. A 180-day forecast can update daily; the prediction window does not dictate how often you score customers.
I use 4 checks to guide the design:
- Data: Set customer IDs, data contracts, feature definitions, and history rules that prevent future information from entering past predictions.
- Delivery: Use batch for scheduled decisions, cached scores for fast lookups, and on-demand inference only when current inputs justify the cost.
- Controls: Set separate limits for data age, scoring, retraining, latency, failures, and recovery. Track prediction quality alongside service health and spending in USD.
- Tool selection: Use the directory to build a shortlist, then test vendor claims, security, exports, and total cost with your workload.
My buying rule is simple: <u>test before committing</u>. Compare predictions with a basic baseline, verify delivery and recovery, and measure the effect on finance-approved revenue or margin - not just model accuracy.
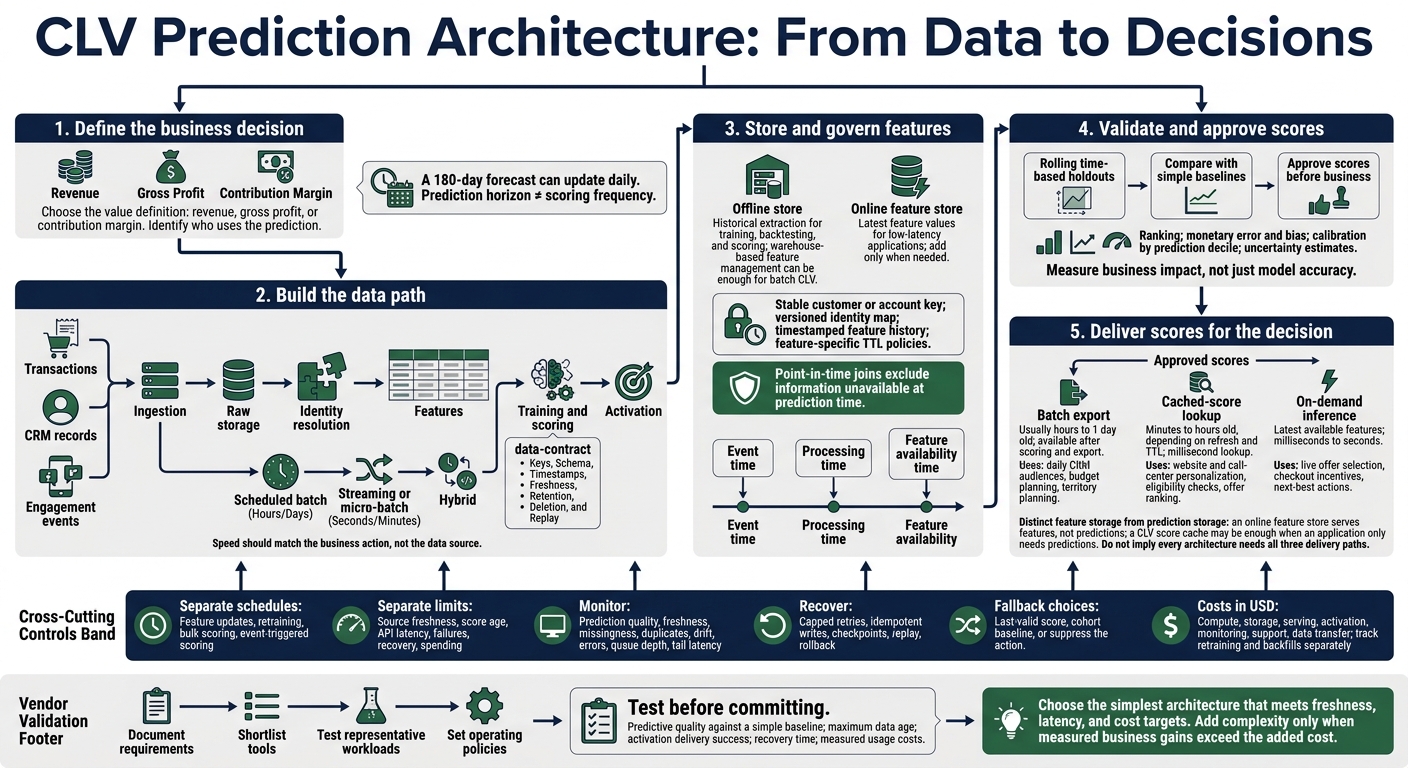
CLV Prediction Architecture: From Data to Decisions
Measuring Customer Lifetime Value: A Data Scientist's Guide
sbb-itb-5174ba0
2. Build Data Pipelines and Feature Storage
Map the full data path and assign an owner at every handoff: transactions, CRM records, and engagement events → ingestion → raw storage → identity resolution → features → training and scoring → activation. Define data contracts that support score freshness and recovery. Each contract should specify keys, schema, timestamps, freshness, retention, deletion, and replay.
Purchase records need
customer_id,order_id,order_value_usd,currency,event_time, andprocessed_at; CRM contracts must define merges and opt-outs.[6][10]
Contracts make freshness, replay, and deletion rules enforceable before modeling starts.
Choose Batch, Streaming, or Hybrid Pipelines
Choose pipeline speed based on the action, not the data source. Purchase-triggered retention updates may need streaming features, while the full CLV forecast can run on a schedule.[5][9]
| Approach | Latency and scale | Complexity and recovery | Cost posture | Suitable CLV decisions |
|---|---|---|---|---|
| Scheduled batch | Hours to days; processes large historical data sets | Lower complexity; rerun failed jobs and backfill affected dates | Usually lowest for periodic workloads | Nightly segmentation, weekly audience refreshes, monthly forecasts |
| Streaming or micro-batch | Seconds to minutes; capacity must handle event peaks | Higher complexity; needs ordering rules, deduplication, checkpoints, and replay | Higher baseline cost; inefficient at low utilization | Purchase-triggered retention updates and immediate suppression |
| Hybrid | Updates selected features between scheduled full refreshes | Reconcile streaming updates with authoritative batch results; backfill both paths consistently | Limits continuous processing to features needed for time-sensitive decisions | Frequent recency updates with daily or weekly CLV scoring |
Match the pipeline to the score’s freshness requirements, then decide where to store each feature.
Choose Offline and Online Feature Storage
Warehouse-based feature management is enough for batch CLV when dashboards and audience tables consume the output. Keep timestamped feature history for training, backtesting, and scoring. Add an online feature store when live applications need low-latency inputs keyed by entity. It serves features, not predictions. If an application only needs predictions, a CLV score cache may be enough. An offline store supports historical extraction; an online store serves the latest feature values.[11][12]
Use a stable customer or account key and a versioned identity map. Preserve merge history rather than silently rewriting past identities. Partition offline data by event date where appropriate, and avoid creating too many small files. Retain data long enough to cover feature lookbacks, prediction labels, and audit needs.
Set feature-specific time-to-live (TTL) policies. Rolling engagement counts need recomputation as events leave their windows. Include freshness metadata with online values, and define what happens when a record is missing before deployment.
Manage Feature Definitions and Event Time
Give every feature an owner and a documented definition. Include its unit, window, source lineage, version, and null policy. Reuse the same tested transforms in training and serving, then verify that their outputs match.[10]
Preserve event time, processing time, and feature availability time. Point-in-time joins must exclude information that was unavailable at prediction time so future data does not leak into training and scoring.[7]
Monitor data age, missingness, duplicates, and abnormal values. Quarantine invalid records instead of silently replacing them with zeros. Use stable event IDs for idempotent replay, lateness policies for corrections, and recorded code and model versions for backfills.[5][8][9] Version schema changes, and carry deletions through raw data, identity maps, features, training extracts, online records, and activation tables.
With features defined and stored, set the model update cadence and score delivery rules.
3. Plan Training, Scoring, and Delivery
Validate Models and Choose Score Delivery
Validate models separately from deployment, and approve scores before business use. Once features are stable, confirm how teams will produce and use scores. Use rolling time-based holdouts and compare models against simple baselines. Score purchase likelihood, frequency, order value, renewal, churn, expansion, refunds, and margin separately before combining them into CLV.
Evaluate ranking, monetary error and bias, calibration by prediction decile, and performance across acquisition channels and customer tenure. Include uncertainty estimates. Test whether score-driven actions improve retention, conversion, margin, or marketing return - not just offline accuracy.[13][17][22]
Choose the delivery path based on the decision it supports, not the model type.
| Delivery path | Freshness and latency | Dependencies | Cost | Business use |
|---|---|---|---|---|
| Batch export | Usually hours to 1 day old; available after scoring and export | Destination connector | Lowest unit cost for large populations | Daily CRM audiences for marketing; budget and territory planning for finance and sales |
| Cached-score lookup | Minutes to hours old, depending on refresh and TTL; millisecond lookup | Score cache | Moderate storage and refresh cost | Website and call-center personalization, eligibility checks, and offer ranking |
| On-demand inference | Uses the latest available features; milliseconds to seconds | Feature access and model API | Highest per-request cost and most failure points | Live offer selection, checkout incentives, and next-best actions |
Every score record needs a customer ID, prediction horizon, score timestamp, feature timestamp, model version, currency code, value definition, eligibility flag, prediction value, and uncertainty bounds.
For APIs, set p50/p95/p99 latency targets that include feature retrieval and network time. Also define sustained and burst throughput, authentication, timeouts, and autoscaling limits. Publish versioned events such as clv.score.updated, clv.score.expired, and clv.score.failed, with event IDs, timestamps, and reason codes. Tag fallback responses, enforce eligibility restrictions, and allow rollback to the previous approved model without changing the consumer contract.[19][20]
Set Update Schedules and Data Age Limits
Feature updates, retraining, bulk scoring, and event-triggered scoring need separate schedules. Distinguish source freshness from score age, and set separate SLAs for each. Expire scores when they exceed their age limits.
Route late arrivals through a correction path that distinguishes operational, historical, and financial corrections. Backfills must follow point-in-time rules and avoid duplicate activation. Retraining can follow a calendar, performance changes, or material business changes. Drift should prompt investigation, not automatic model promotion.[14][15][16][18]
| Feature behavior | Update cadence | Storage | Scoring trigger | Acceptable staleness |
|---|---|---|---|---|
| Slow-moving: customer segment, acquisition source, basic demographics, historical margin band | Daily to monthly, or when mastered data changes | Offline warehouse; optionally replicated online | Scheduled bulk scoring or profile change | 1 day to several weeks |
| Periodic: 30-day orders, 90-day revenue, subscription status, campaign response | Hourly to daily | Offline store plus online cache for active use cases | Scheduled scoring; subscription or major order events | Minutes to 24 hours |
| Fast-moving: current cart, recent session activity, payment failure, support escalation, cancellation signal | Seconds to minutes | Online feature store or stream-backed cache | Event-triggered or on-demand scoring | Seconds to minutes |
These schedules determine compute load, storage growth, and exposure to failures.
Control Costs and Handle Failures
More frequent updates and lower latency increase compute and serving costs. Report cost per million customers scored, per million events processed, per customer-year of feature and score storage, per API prediction, per retraining run, and per backfill. Where applicable, include cost per activated audience or downstream destination.
Report in USD and specify which costs are included: compute, storage, serving, activation, monitoring, support, and data transfer. Track retraining and backfills separately. For multi-region designs, include duplicated capacity, storage, and cross-region transfer.
Reduce spending with incremental computation, reusable aggregates, selective streaming, caching, and tiered storage. Keep training and backfills separate from interactive serving. Enforce budgets, concurrency limits, and autoscaling ceilings.
Use capped retries with backoff and jitter, idempotent score writes, checkpoints, and dead-letter queues with replay procedures. Monitor drift, calibration, freshness, errors, queue depth, and tail latency. Define when to serve a last-valid score, use a cohort baseline, or suppress the action.
Test restoration against documented recovery objectives and verify rollback. Budget for recovery tests and backfill rescoring. Cap retry volume to prevent outage-driven spending spikes.[15][16][21]
4. Compare CLV Software in a Tools Directory
Use the Marketing Analytics Tools Directory only to build a shortlist. Verify CLV claims through official documentation, contracts, and workload tests. Score each vendor against the data-age, latency, scale, delivery, and recovery targets defined above.
Check Architecture Capabilities
Apply the same scorecard to every vendor. Label each capability native, via integration, requires custom infrastructure, or unverified, and record what’s included, required dependencies, and limits.
“Real-time” ingestion does not prove real-time scoring or activation.
| Capability | Vendor proof required |
|---|---|
| Connectors | Supported sources, API limits, update intervals, and historical backfill coverage |
| Scheduled and event-level processing | Processing documentation and measured delay, throughput, ordering, and deduplication |
| Feature management | Historical join tests, feature versions, lineage, and store dependencies |
| Prediction horizons | Configuration, API schema, and test outputs confirming supported horizons |
| Value definitions | Formulas and sample calculations for revenue, gross margin, contribution margin, retention, discounting, and cost to serve; treatment of refunds, discounts, and costs |
| Training controls | Run history, model lineage, and which changes buyers control versus changes only vendors can make |
| Serving interfaces | Batch tables, APIs, webhooks, or embedded apps; latency tests, delivery logs, rate limits, and stale-feature behavior |
| Activation destinations | End-to-end delivery test to required CRM, CDP, advertising, messaging, or customer-success systems |
| Scale limits | Benchmarks and contractual limits for customers, events, concurrency, and retention |
| SLAs | Contractual data-age, availability, recovery, incident response, and support targets; measurement methods, exclusions, and remedies |
Check Governance, Total Cost, and Portability
Verify role-based permissions, single sign-on, encryption in transit and at rest, audit logs, regional hosting, retention, deletion workflows, tenant isolation, and sensitive-data controls. Check that monitoring covers data age, schema changes, missing values, feature and prediction drift, and model performance once outcomes mature. Require lineage from each source event through the feature, model version, score, and activation destination.
Test an exit before signing. Verify export formats, full API extraction, data ownership, and model and feature portability. Export a sample with identifiers, timestamps, and versions, then reproduce its scores within an agreed tolerance.
Compare proposals using the same customer counts, event volumes, scoring frequency, retention period, model count, API volume, destinations, environments, and support tier - not list price alone.
| Cost category | Standardize across proposals | Record in USD |
|---|---|---|
| Subscription or platform fee | Production and nonproduction environments, users, models, and included volume | Monthly and annual fees; minimum commitment |
| Implementation | Data modeling, connector setup, migration, testing, and training | One-time fee; custom-work hourly rates |
| Compute | Feature processing, training, batch scoring, and real-time inference | Monthly estimate; unit rates and idle-capacity charges |
| Storage | Raw data, feature history, model artifacts, logs, and backups | Monthly estimate; retention assumptions |
| Data transfer | Cross-region movement, warehouse extraction, API egress, and activation delivery | Monthly estimate; transfer and connector charges |
| Support | Standard, premium, incident response, and named technical contacts | Included service versus paid support |
| Overages | Additional events, API calls, seats, models, destinations, or storage | Thresholds, unit prices, spending caps |
After checking capabilities, governance, and costs, run a production-sized pilot.
Test Business Fit Before Buying
Use production-sized customer volumes and historical snapshots in the pilot. Include late events, refunds, missing data, and account merges.
Agree on pass/fail criteria before testing: predictive quality against a simple baseline, maximum data age, activation delivery success, recovery time, and measured usage costs. Compare a sample against independently calculated outputs and resolve discrepancies.
For small businesses, document who maintains connectors, handles schema changes, monitors models, and responds to failures. A low subscription price can hide high staffing needs.
Run a controlled experiment.[23] Report results using the finance-approved revenue or margin definition chosen for CLV. For PE-backed or mid-market operators, report business impact in dollars, not just AUC, lift, or mean absolute error.
5. Conclusion: Match Architecture to Business Decisions
Start with the business decision, not the infrastructure. Choose the simplest architecture that meets your decision horizon, data freshness, latency, and cost targets. Use batch for delayed decisions, streaming only for fast-changing signals, and hybrid only when you need both.
Keep training data point-in-time correct to prevent leakage from future events[24]. Set separate policies for feature refresh, scoring, and retraining. Monitor score coverage, data freshness, failures, cost per 1,000 customers, and model quality.
Add complexity only when measured business gains exceed the added cost. Apply the same requirements when comparing marketing analytics tools in the directory: document requirements → shortlist tools → test representative workloads → set operating policies.
FAQs
When is real-time CLV worth the added cost?
Real-time customer lifetime value (CLV) prediction is worth the added cost when revenue-driving actions can’t wait for batch processing. These include cart abandonment alerts, dynamic pricing, and churn prevention [1][2][3]. Companies using real-time processing report 23% higher revenue growth and 30% lower acquisition costs [3].
When comparing tools in the Marketing Analytics Tools Directory, prioritize elastic auto-scaling and serverless architectures to control costs during peak demand [4][3].
How can I set the right CLV scoring frequency?
Choose your CLV scoring frequency based on your business needs, how fast customer data changes, and how soon you need to act on the results [1]. Real-time streaming supports immediate responses to customer behavior. Batch processing is often enough for simpler models or smaller datasets [2][3].
When comparing tools, check that they support your chosen update interval and automatically flag synchronization issues. These checks help keep CLV calculations reliable and accurate [1].
How can I verify a CLV vendor’s scale claims?
Test performance under load before full implementation by running a pilot with a representative dataset. Check the cloud infrastructure, sub-second latency for real-time operations, capacity for millions of records, API compatibility, data ingestion rates, and support for parallel jobs.
Use the Marketing Analytics Tools Directory to compare technical specifications, user feedback, and integration depth. Check whether each solution can meet your growth requirements.