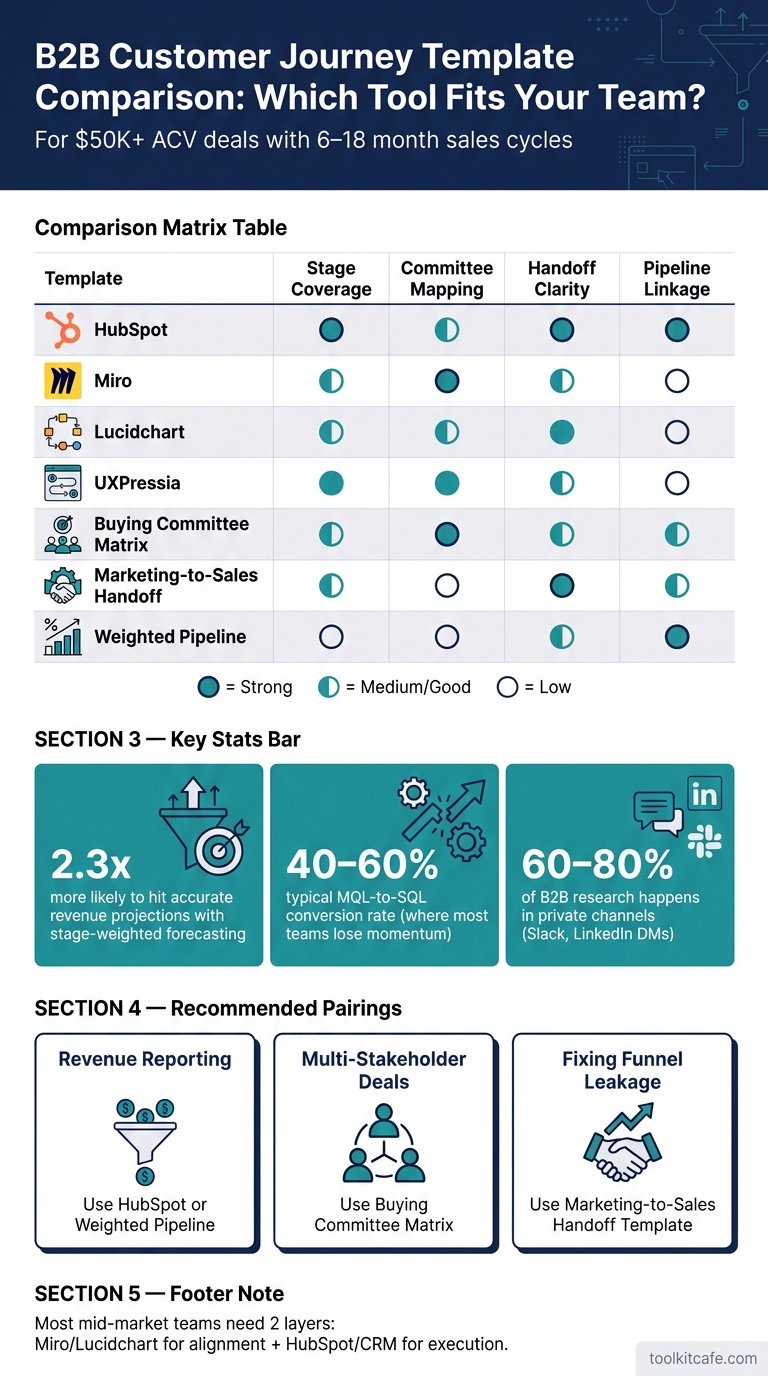
If you run $50,000+ ACV deals with 6- to 18-month sales cycles, I’d use more than one template - not just one. For most mid-market B2B teams, HubSpot is the best fit for pipeline tracking, Buying Committee Matrix is the best fit for multi-stakeholder deals, and Marketing-to-Sales Handoff templates are the best fit for fixing funnel leakage.
I’d boil the article down to 3 points:
- Use CRM-based templates for execution and forecasting. They tie stage movement to deal value and support weighted pipeline reporting. Teams using stage-weighted forecasting are 2.3x more likely to hit accurate revenue projections.
- Use visual templates for alignment, not daily management. Miro, Lucidchart, and UXPressia help teams map journeys, owners, and friction, but they rely on manual updates.
- If your deals involve 6 to 8 stakeholders and 60+ touchpoints before close, committee and handoff structure matter as much as stage mapping.
B2B Customer Journey Template Comparison: Which Tool Fits Your Team?
[Template demo] How to Create a B2B Buyer Journey
sbb-itb-5174ba0
Quick Comparison
| Template | Best use | Stage coverage | Committee mapping | Handoff clarity | Pipeline linkage |
|---|---|---|---|---|---|
| HubSpot | Lead-to-close tracking | Strong | Good | Strong | Strong |
| Miro | Team workshops | Medium | Strong | Medium | Low |
| Lucidchart | Process and ownership mapping | Medium | Medium | Good | Low |
| UXPressia | Multi-persona journey mapping | Good | Good | Medium | Low |
| Buying Committee Matrix | Stakeholder tracking by account | Medium | Strong | Good | Medium |
| Marketing-to-Sales Handoff | Funnel control and SLAs | Medium | Low | Strong | Medium |
| Weighted Pipeline | Forecasting | Low | Low | Medium | Strong |
My take is simple: pick the template based on the bottleneck. If you need revenue reporting, start with HubSpot or a CRM-linked pipeline model. If deals stall because too many people shape the decision, use a buying committee matrix. If leads leak between teams, fix the handoff first. Most teams do best with a mix: one format for planning, one for running the funnel.
1. HubSpot Customer Journey Map Templates

HubSpot fits best when your funnel is mostly linear. Its six-stage funnel - Lead, MQL, SQL, Opportunity, Proposal, Closed Won [4] - works well for teams running an inbound motion with clear stage-to-stage movement [3]. After Closed Won, the model can carry into onboarding and customer success, which helps teams keep the customer path in one system [4]. If your process is driven by stages more than by a buying committee, HubSpot is usually a strong fit.
For more complex deals, HubSpot can still map activity across a buying group. Contacts from the same company roll up into one account view, so teams can see what 6-8 stakeholders are doing across the main buying roles in one place [6]. That setup also makes handoffs easier to define because sales, marketing, and post-sale teams are looking at the same account record.
HubSpot also gives teams direct control over handoffs. Required fields can stop a deal from moving stages until the needed handoff data is filled in [3]. A response SLA - for example, sales responding to MQLs within 4 business hours - helps cut MQL-to-SQL leakage [4]. Weighted forecasting then turns stage movement into revenue projections using connected spreadsheet tools, and teams using that method are 2.3x more likely to achieve accurate revenue projections [4].
The trade-off is customization. HubSpot works best for straightforward inbound motions with a mostly linear funnel [3]. More complex enterprise deals may need you to extend the default template, and deeper multi-touch attribution may call for third-party tools [3][5].
A simple stage map looks like this:
| Stage | Entry/Handoff Criteria |
|---|---|
| Lead | Contact info captured; source documented |
| MQL | Fits ICP; shows intent, such as a demo request |
| SQL | Discovery call completed; BANT/MEDDIC met |
| Opportunity | Budget confirmed; decision-maker engaged |
| Proposal | Formal quote delivered; pricing shared |
| Closed Won | Contract signed; payment terms confirmed |
2. Miro B2B Customer Journey Map Template

Miro works best for journey workshops, not live pipeline management. It helps teams get on the same page across functions, but it falls short when you need day-to-day revenue tracking. Across the four criteria, committee mapping is strong, handoff clarity is moderate, and pipeline linkage is weak. So yes, Miro is useful for alignment. It is not the right fit for teams that need live revenue data in the same place.
Miro can map the full lead-to-close journey, including multi-touch buying paths. You can set up separate swim lanes for the economic buyer and the end-user, which makes it easier to see how each member of the buying committee moves through the process. That visual view is strong. The operating side is not.
The main gap is simple: the map does not sync with live systems. There is no native connection to your CRM or behavioral analytics, so teams have to update pipeline metrics by hand. For a weekly pipeline review, that creates extra work and leaves too much room for stale data.
Miro is more useful in the diagnostic stage. Friction scores on a 1–5 scale can help teams spot where marketing-to-sales or sales-to-success handoffs break down. You can also layer aggregate conversion benchmarks onto the canvas, including the standard MQL-to-SQL range of 40–60%, as a reference point [4]. Use Miro for the workshop, then move the output into your CRM for execution.
Teams that need the map connected to pipeline should shift from workshop design to a more operational template.
3. Lucidchart Customer Journey and Swimlane Templates
Lucidchart is best for static process mapping, not live pipeline tracking. Use it when the goal is to get clear on ownership and handoffs before tying the process to pipeline data.
Its main strength is internal process visibility. Swimlane templates make it simple to show who owns each step across Marketing, Sales, and Customer Success, and what triggers the next handoff. That matters because many B2B funnel leaks happen at the Lead-to-MQL and SQL-to-Opportunity transitions [4].
A swimlane map can spell out exit criteria, such as BANT or MEDDIC qualification, alongside response SLAs like a 4-business-hour follow-up target. In plain terms, Lucidchart records the SLA. HubSpot enforces it in the CRM [2][4].
Lucidchart also helps teams connect buyer experience to internal execution. A standard journey map usually centers on website analytics to map buyer touchpoints, friction, and emotional stages. For mid-market teams, the stronger setup combines those buyer touchpoints with internal owners and handoffs. That’s where Lucidchart tends to fit best: turning scattered touchpoints into a clear ownership model.
The tradeoff is manual upkeep. For enterprise deals above $100,000, journey complexity can reach about 417 touchpoints across a 272-day cycle [5]. At that point, maintaining the map becomes real work. Use Lucidchart to define ownership and SLAs, then enforce them in the CRM.
For teams that need stakeholder visibility more than process diagrams, the next format is the buying committee matrix.
4. UXPressia B2B Customer Journey Map Templates
UXPressia is best at mapping complex account journeys with many stakeholders involved. Its templates split the end-user journey from the economic buyer journey inside the same account map. That makes it useful when a team needs to see how different buyers move through one deal.
UXPressia covers the full B2B journey: Problem Identification, Research and Discovery, Stakeholder Consensus, RFP and Vendor Evaluation, Negotiation, and Procurement [1]. It fits best when consensus-building is a clear stage in the buying process.
There’s a tradeoff, though. UXPressia is good at documenting the journey, but it does not tie the map back to performance data or pipeline metrics.
If your team needs stakeholder roles mapped in a more explicit way, the next format is the buying committee matrix.
5. Buying Committee Matrix Templates
Buying committee matrix templates matter for 2 of the 4 evaluation criteria: committee mapping and pipeline linkage. Their job is simple. Map each stakeholder by role - Decision Maker, Champion, Influencer, End User - and show how each person affects the deal as it moves through the buying cycle. The main question is not who happened to touch the deal. It’s which signals should trigger the next handoff.
In enterprise deals above $100,000, the path is long and messy. These deals can run across roughly 417 touchpoints and 5,500 impressions over 272 days [5]. A good matrix connects stakeholder activity to CRM accounts and tracks both positive and risk signals. Positive signals include sponsor engagement and budget confirmation. Risk signals include stakeholder silence [2].
That’s why the matrix should do more than log stakeholders. It should support handoff rules. For example, it should spell out when a champion has shown enough engagement to move an account from marketing-qualified to sales-qualified. It should also keep fit, content, and intent data attached to the account as the deal shifts into sales conversations [2][4]. If that structure is missing, self-reported influenced pipeline can overstate CRM-verified pipeline by 2 to 4x [6].
There’s also a blind spot many teams miss: private sharing channels. Roughly 60% to 80% of B2B research happens in places like Slack groups or LinkedIn DMs [6]. That means a strong matrix template should include a self-reported attribution field on demo forms, so teams can catch peer recommendations and other signals that are hard to track. That field only helps if the data flows into CRM reporting, not if it sits in a static map.
6. Marketing-to-Sales Handoff Templates
Once you've mapped buyers and stakeholders, the next job is simple: lock down the handoff. A marketing-to-sales handoff template sets the rules for movement in the funnel - who owns the record, what data must be there, and when the record can move to the next stage. The best templates don't leave room for guessing. They spell out each stage's entry point, owner, and exit rule.
Here’s the minimum data needed at each stage:
| Stage | Entry Criteria | Required Fields | Owner |
|---|---|---|---|
| MQL | ICP fit + intent signals (e.g., demo request) | Lead source, Company size | Marketing |
| SQL | Discovery call completed, BANT/MEDDIC met | Pain points, Budget range | Sales |
| Opportunity | Budget confirmed, decision-maker engaged | Decision maker, Timeline | Sales |
| Proposal | Formal solution/pricing presented | Proposal doc, Deal value | Sales |
| Closed Won | Signed contract, payment terms confirmed | Contract date, Payment terms | Sales |
Source: ToolkitCafe and DevriX frameworks [4][3][7]
Most handoff templates break for one reason: ownership and SLAs aren't clear. If no one knows who acts next, leads sit. If the response window is fuzzy, follow-up slips. A 4-business-hour response window for MQLs is a common benchmark [4]. The usual MQL-to-SQL conversion rate is 40% to 60%, and that handoff is where many teams lose momentum [4].
That means the template needs 3 hard rules:
- A set response window
- A named owner for each stage
- An automatic trigger for the next action
"Every high-priority alert should lead to a clear action. If a signal does not change targeting, routing, follow-up, prioritization, or reporting, it may not need to create a workflow at all." [7]
Spreadsheets are still useful, but mostly for conversion analysis and funnel diagnostics. CRM templates do the day-to-day work. They enforce required fields, assign ownership, and fire alerts when a record needs action. That's the difference between a process that exists on paper and one that runs in the business. For mid-market teams, pipeline control comes from CRM enforcement, not static maps.
The next section compares where this format fits best against the other five template types.
Strengths, Tradeoffs, and Analytics Fit
After looking at each template on its own, the next step is simple: figure out which ones help teams align, which ones help them run the work, and which ones help them track revenue. That split matters because an alignment tool and an execution tool do different jobs.
Where each template format is strongest
Each format has a clear use case.
HubSpot and CRM templates are strongest for daily pipeline management and lead-to-close tracking. They tie email, ads, site visits, stage conversion, and closed-won revenue into one system. If the goal is to see how demand turns into deals, this is the strongest option.
Miro and Lucidchart work best in workshops and stakeholder sessions. Their job is visual alignment. They help teams map the buyer journey and get people to agree on what they’re seeing, but they are not built for reporting.
UXPressia goes deeper into persona work and emotion mapping. That makes it a better fit for UX-heavy onboarding flows and persona research than for sales reporting.
Buying Committee Matrix templates are built for enterprise selling, where multiple people shape the deal and each one plays a different role.
Marketing-to-sales handoff templates are the most process-driven of the group. They exist to enforce SLAs, tighten the MQL-to-SQL transition, and reduce lead leakage.
The harder part is not choosing a format. It’s getting that format ready for live use.
Common limitations and customization needs
Most templates stop at Closed Won. They don’t map renewal or expansion, which leaves out a big part of B2B revenue. Some also need custom fields for Closed Lost reasons so teams can track why deals fail and use that data later.
Before most teams can use these templates in production, they usually need to add:
- stage exit criteria
- owner fields
- SLA fields
- CRM-linked conversion metrics
Those gaps show up across formats [3][5][4][2].
Visual tools have another weak spot: they miss buyer activity that never gets tracked. If buyers do their homework in private, ask peers for input, or interact in channels the team doesn’t own, a digital-only journey map will understate influence.
Pros and cons table for all six formats
The table below cuts each format down to its main use case, main weakness, and best fit.
| Template Format | Primary Strength | Main Limitation | Best Fit |
|---|---|---|---|
| HubSpot / CRM templates | Quantitative tracking, CRM sync, closed-won linkage | Misses dark funnel and unowned touchpoints | Mid-market teams with high lead volume |
| Miro / Lucidchart | Visual collaboration, flexible layout, workshop-ready | Static; no live data linkage | Initial journey discovery and team alignment |
| UXPressia | Persona and emotion mapping | High maintenance; limited quantitative output | UX-heavy product onboarding and persona research |
| Buying Committee Matrix | Multi-stakeholder account tracking [1] | Not useful for high-velocity or SMB sales | Complex enterprise deals with multiple decision-makers |
| Marketing-to-Sales Handoff | Conversion velocity, SLA enforcement, MQL/SQL diagnostics | Ignores post-sale expansion; requires cultural buy-in | Sales and marketing alignment at the funnel midpoint |
| Weighted Pipeline (Excel / CRM) | Revenue forecasting using stage-based probability [2] | Can inflate projections without strict exit gates | Financial forecasting and pipeline review cycles |
Analytics fit for mid-market revenue teams
For mid-market teams, the test is straightforward: can the template feed reporting and forecasting, or not? That’s where many templates fall short.
Most mid-market teams need more analytics tools for business than these formats give them out of the box. The average B2B funnel converts just 2% to 5% of leads into customers, while top performers hit 8% to 12% [4]. If a team wants to close that gap, it needs clear visibility into where deals slow down. That means conversion metrics, time-to-stage data, and CRM export capability need to be built in.
There’s a forecasting angle too. Organizations using stage-weighted forecasting are 2.3x more likely to hit accurate revenue projections than teams using unweighted methods [4].
| Metric / Feature | CRM-Integrated (HubSpot) | Visual (Miro / Lucidchart) | Funnel Spreadsheets |
|---|---|---|---|
| Conversion rates | High - automated | Low - manual entry only | High - formula-based |
| Time-to-stage tracking | High - native | None | Medium - requires date entry |
| Influenced pipeline | Medium - owned channels only | None | Low |
| Post-sale tracking | High - via CS Hubs | Low | Medium |
| CRM / BI export readiness | Native | Manual or image export only | High - CSV / XLSX |
| Fit for $10,000-$250,000 deals | Excellent | Good for strategy sessions | Excellent for forecasting |
Conclusion
There’s no one template that works for every B2B workflow. The right pick comes down to your team’s main job. In practice, most mid-market teams need more than one format to cover the full revenue cycle.
Best template by business need
Pick the format based on what you need most: team alignment, cleaner handoffs, or revenue reporting. The recommendations below line up with the same 4 checks: stage coverage, committee mapping, handoff clarity, and pipeline linkage.
Use the table below to match the business need to the right template format.
| Business Need | Recommended Template Format |
|---|---|
| Lead-to-close visibility | HubSpot Customer Journey Map Templates |
| Complex buying committees | Buying Committee Matrix Templates |
| Marketing-to-sales handoffs | Marketing-to-Sales Handoff Templates |
| Pipeline & revenue reporting | HubSpot CRM / Weighted Pipeline Templates |
| Team alignment and discovery | Miro or Lucidchart Templates |
Recommended pairings for mid-market teams
Most mid-market teams need 2 layers: a map for alignment and a CRM layer for execution. A practical setup is to use Miro or Lucidchart for alignment, pair that with a Buying Committee Matrix for stakeholder coverage, and then run HubSpot or CRM-linked handoff templates for reporting.
FAQs
Which template should I start with first?
Start with one high-value segment, not every possible path. In most cases, that means your main inbound marketing funnel or your enterprise sales cycle.
If your data setup is still taking shape, begin with an ICP template so marketing, sales, and product are working from the same view of the target customer. From there, use a sales pipeline template or a simple buyer’s journey template to map what happens next.
Do I need both a visual map and a CRM template?
Yes. A visual map and a CRM template do different jobs, and you usually need both.
Use the visual journey map to lay out and review the full customer experience from start to finish. It helps you see what buyers go through, where friction shows up, and where handoffs or gaps may hurt conversion or retention.
Use the CRM template for day-to-day work - managing deals, tracking activity, and keeping contact records up to date. That’s the system your team works in every day.
The key point is connection. The journey map should link back to CRM data so your planning is based on what customers and prospects are actually doing, not what the team assumes they’re doing.
How do I handle multi-stakeholder B2B deals?
Map the full buying committee to each deal stage - champion, economic buyer/CFO, and technical influencer or end user - so each group gets the right enablement at the right time.
Quantify business impact. Document the events that trigger a deal decision. Use clear CRM entry and exit criteria, along with MEDDIC or BANT-style checks, to keep deals from entering the pipeline too early. Track pipeline and revenue through real-time CRM visibility and account-level attribution.